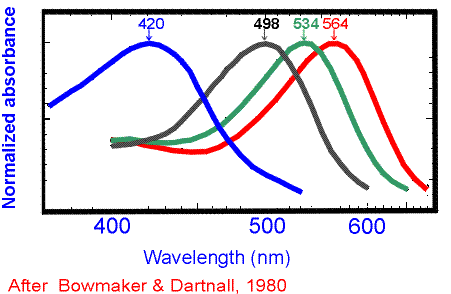

They found four classes of photopigments as shown in the above graph. The colors of the curves do not represent the colors of the photopigments. The wavelength of maximum absorbance is indicated at the top of each curve. The 420 curve is for the short wavelength cones, the 498 curve is for the rods, and the 534 and 564 curves are for the middle and long wavelength sensitive cones respectively.
Click here and you can see the absolute spectral sensitivity of the rod and cone systems.
Table of Contents
Subject Index
Table of Contents [When not using framtes]