11.06
Two years ago I received a Category II AIF (Academic Innovation Fund) award from the AVP Teaching & Learning at York University to develop a vibration test experiment for the Space Engineering curriculum. All spacecraft and components undergo a number of environmental tests to ensure they will function correctly after launch and during exposure to on-orbit conditions. The goal of the experiment for our students was to give them an exposure to a typical vibration test for a spacecraft or spacecraft component. (I have also received a second AIF award for a Thermal-Vacuum test – more on that in a later post).
With the AIF funding, I decided to design and build a Printed-Circuit Board which would have a number of chip accelerometers (ADXL345). This would allow students to perform the usual vibration test, where acceleration on the board is measured by test accelerometers, but also in later experiments monitor acceleration from up to 7 different locations on the board. With a larger number of monitored locations, it allows the students to possibly study vibration mode shapes (the devices themselves provide a max bandwidth of 1.6 kHz – max sample rate of 3.2 kHz). It actually turns out that the measurement acquisition problem is more challenging than the vibration problem. So this allows the hardware to be re-used in a second experiment in another course that I teach in the Space Engineering curriculum.
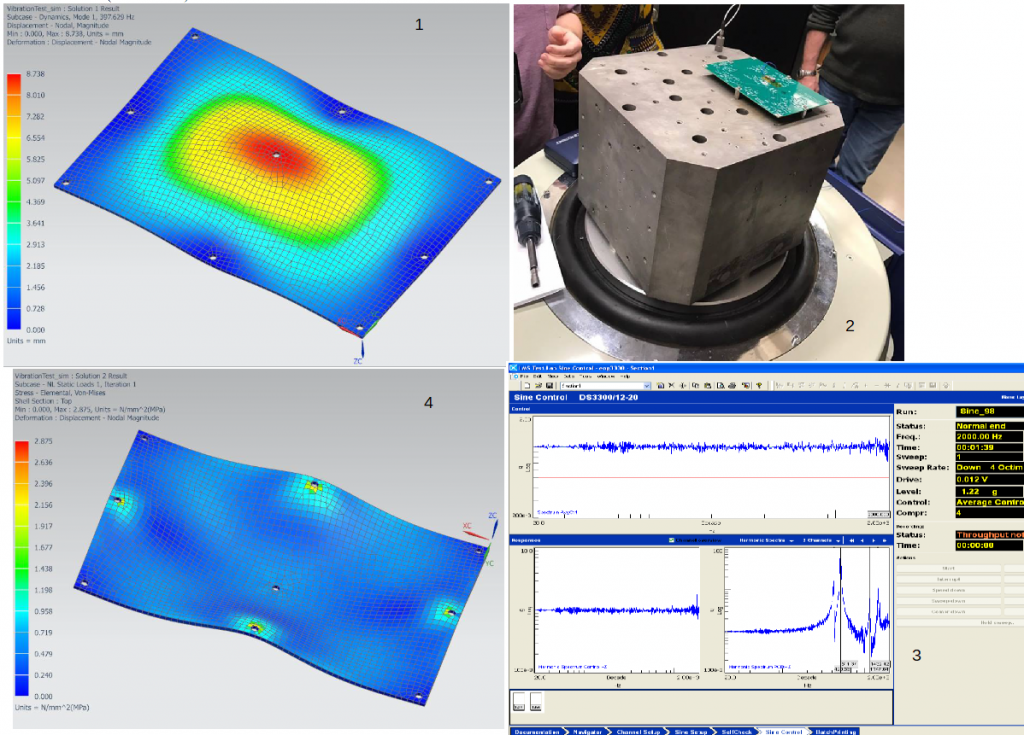
I have been running the vibration experiment for 2 offerings of ENG 3330 (Materials for Space Application) – the students perform finite element analysis and calculate the board Normal modes and response to sine and random inputs. We are using Prof. Ben Quine’s shaker facility to do this (thanks to Ben for allowing us to do this every year). It’s a 4-step process as shown in the Figure below:
1. Students predict the Normal modes of the PCB prior to the test. Here we use NX and NX Nastran (space industry standard software tools).
2. We run the test using the shaker facility – Low level sine, Full level sine and random vibration tests. Test levels are based on the Nanoracks tests specified for CubeSats released from the ISS.
3. The students take the measured outputs from the shaker and compare them with the predicted results. (Reflection component of experiential learning)
4. The final step is to perform a stress prediction for the Full level sine and random vibration tests to show the structure’s margin of safety and hence providing evidence of its ability to survive launch and work in space (i.e. its now “qualified” for launch).
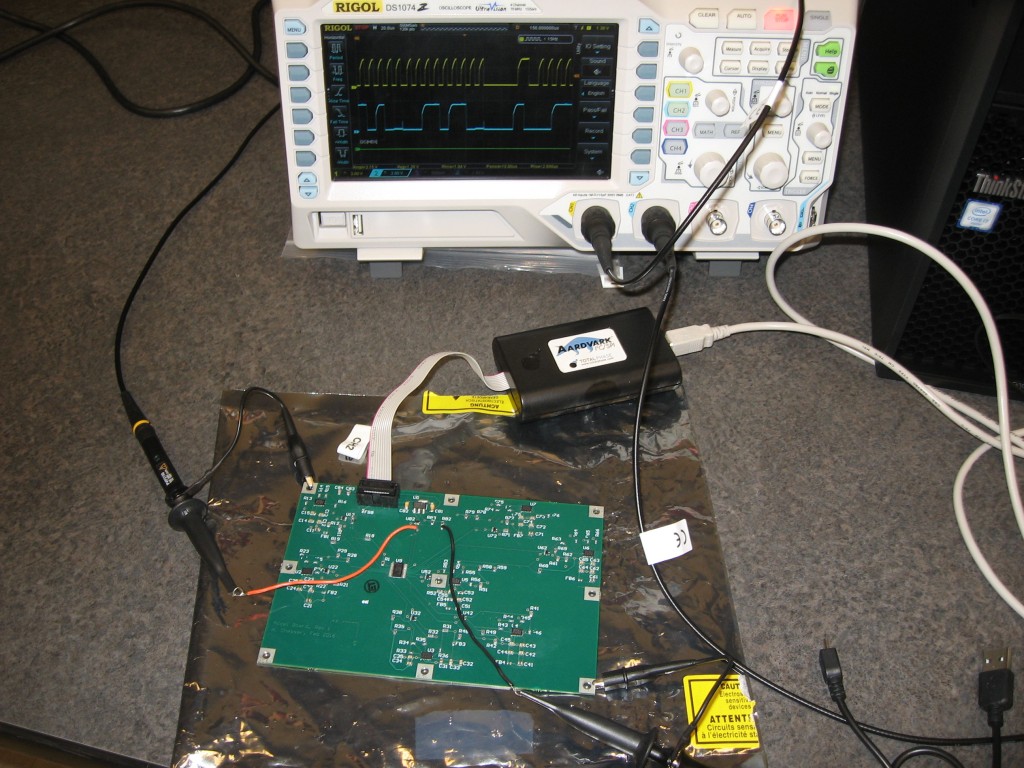
This year I have re-used the same PCB in a second experiment this time for ENG 4350 (Space Hardware) to get the students learning about I2C communications and data acquisition with LabVIEW. The accelerometers are read using an Aardvark I2C adapter which plugs into a USB port of a Windows PC. Not the best platform for high speed data acquisition, but it is the standard lab set-up we have. We break out the I2C lines to the board so that students can use a scope to look at the I2C messages and use the scope’s decoding functions. The experiment has students talking to both a multiplexer and the 7 accelerometer chips on the board. This second experiment is shown in the figure below:

