Fitton, D., MacKenzie, I. S., and Read, J. C. (2024). Investigating the impact of monetization on children’s experience with mobile games. Proceedings of the ACM Conference on Interaction Design and Children – IDC 2024, pp. 248-258. New York: ACM. doi:10.1145/3628516.3655794 [PDF]
ABSTRACT: Monetization is fundamental to “free-to-play” mobile games, typically in the form of advertising placed within gameplay. Monetization within digital games is linked to deceptive design, and other ethically dubious practices such as loot-boxes. However, it is unclear what impact monetization has on the overall player experience. This research measured the experience and player performance in an experimental “Pong”-style game in three conditions: no advertising, static-interstitial advertising, and video-advertising. A between-subjects study was carried out with 95 participants aged 9-11 years playing the game in one of the three conditions, then completing the FunQ questionnaire. Results showed that while the static-interstitial advertising condition had a negative impact on player experience and player performance the video-advertising condition did not. Findings were ‘reported back’ to a group of the original child participants, feedback gathered during this session showed that children understood the findings and were able to contribute both additional insights and ideas for future research. Investigating the Impact of Monetization on Children’s Experience With Mobile Games
Dan Fitton1, I. Scott MacKenzie2, Janet C. Read3
1University of Central Lancashire, Preston, UK
dbftton@uclan.ac.uk2York University Toronto, Canada
mack@yorku.ca3University of Central Lancashire Preston, UK
jcread@uclan.ac.uk
CCS CONCEPTS: Human-centered computing • Human-computer interaction (HCI) • User studies.
KEYWORDS: Free-to-play; Freemium; Monetization; Advertising; Deceptive Design; Dark Design Patterns; Apps; Games; Children
1 INTRODUCTION
Free-to-play, or “freemium,” is an economic model whereby mobile apps and games impose no upfront cost for downloading and installing. This model dominates the mobile industry with over 96% of apps on the Android play store currently classed as “free” [1]. To generate revenue from “free” mobile games, a variety of monetization mechanisms are used. These typically rely on placing advertising within the game or on encouraging the player to make small payments (microtransactions) with actual currency. The free-to-play model, and its associated monetization, is highly successful with revenue within the mobile games sector forecast to exceed $173 billion in 2023 [17].Monetization tactics within mobile games are associated with deceptive design and deceptive design patterns, sometimes called “dark design” – defined as “a user interface carefully crafted to trick users into doing things they might not otherwise do” [4]. A widely experienced example is the small “×” target for dismissing adverts in mobile games. This often results in registering the interaction as tapping the advert rather than dismissing it.
In prior work, monetization within mobiles games is identified as an “annoyance” to players [2, 6]. This is unsurprising within advertising-based monetization as the delivery of interstitial adverts both interrupts and occludes gameplay. With microtransaction- based monetization, purchases are often required to progress and succeed in the game. However, no work has specifically explored the impact of different forms of monetization on gameplay performance and user experience. Additionally, most prior work on deceptive design and monetization focuses on adult users; far less work has considered young users known to be prolific users of mobile games.
This paper presents the results of a study to explore the impact of advertising-based monetization on gameplay experience and gameplay performance with children. The study was conducted with 95 children aged 9-11 years playing a “Pong”-style game in one of three conditions: Control with no adverts, Ads which included an interstitial advert at the end of each level, and Video_Ads which allowed players to optionally watch a video clip to avoid being demoted to a lower-level within the game.
The game automatically recorded player performance during gameplay. After playing the game for 15 minutes children completed a paper evaluation form which included the 18 FunQ questions [20] to measure gameplay experience. Results from our study contribute two new findings valuable to those developing or studying mobile-games. First, interstitial static pop-up advertising within mobile games can have a negative impact on player experience and player performance. Second, appropriately designed advertising-based monetization can have a positive impact on player experience and player performance. These findings are particularly important due to the prevalence of mobile gaming and pervasiveness of monetization in free-to-play mobile games. In this paper we also present our work ‘reporting back’ the findings to a subset of the child participants to help them understand the research that they participated in and gather additional insights.
2 RELATED WORK
Monetization within “free-to-play” mobile games is commonly achieved through advertising delivered via a network API such as Google AdMob, Unity Ads, or Facebook Ads. These allow adverts to be retrieved at run-time as required [4]. The ad network API collects metrics of user exposure along with other analytics and user information [5]. These are used to calculate remuneration paid to the game publisher based on metrics such as “cost per mile” (1000 views of an advert) [6].
The placement of advertising within a game is dependent on the facilities provided by the ad network and the design choices made by the developer. Five distinct types of mobile adverts have been identified [4, 7]:
- Offerwall – typically an interstitial advert that interrupts an app by taking over the screen to offer a reward in exchange for a user action.
- Popup – a window that appears on top of an app’s interface to show advertising content; these typically have some kind of close button provided, and may be any size from interstitial downwards.
- Notification – messages pushed to the user through OS-level notification mechanisms.
- Floating – small floating windows in front of an app’s interface.
- Embedded – a fixed part of an app such as a banner advert.
When an advert is encountered within a mobile game, this is likely to take the form of a static image, video clip/animation or even an advergame (an interactive game within an advert) which is effectively a hyperlink which, if the user interacts with the screen, takes the user to the subject of the advert (i.e., product web site or app-store page).
Within the CHI research community there is a growing body of research focusing on deceptive design with web sites and cookie consent banners (e.g., [8, 10–12]), adult experiences of deceptive design (e.g., [3, 7]), and mobile apps more generally [5]. However, deceptive design with gaming has received comparatively less attention. Zagal et al. [23] were the first to classify deceptive design patterns within games which they define as “pattern[s] used intentionally by a game creator to cause negative experiences for players which are against their best interests and likely to happen without their consent.” The definition is especially relevant as it highlights the potential impact on player experience. The Zagal et al. work from 2013 pre-dates the rise of free-to-play mobile games and does not specifically reference advertising but does identify the use of “grinding” (repetitive in-game tasks) as a means to extend a game’s duration which could repeatedly expose the player to advertising and therefore increase advertising revenue.
In more recent work in the context of free-to-play mobile games, Fitton and Read [8] conducted a study with participants aged 12-13 years and presented the ADD (App Dark Design) framework with six categories of deceptive design patterns. Two categories in the ADD framework specifically relate to advertising; “disguised ads” which include advergames and character placement within games, and “sneaky ads” which include difficult/deceptive to dismiss adverts, camouflaged game items, and notification-based ads.
Adult experiences of monetization within games (desktop and mobile) have been studied by Petrovskaya and Zendle [13] where participants reported that many of their experiences of monetary transactions within games were “misleading, aggressive or unfair.” While no previous work has sought to understand the specific impact of advertising-based monetization, prior work shows that advertising-based monetization is a practice well established within the mobile games industry whilst suggesting that monetization in general does not make a positive contribution to player experience.
3 METHOD
3.1 Participants
All participants (>100, initially) were primary school children aged 9-11 years. Data were collected during five school visits in the North West region of the UK. The children visited the University of Central Lancashire to participate in research studies and STEM activities as part of a MESS (Mad Evaluation Session with Schoolchildren) Day session [9].
At a MESS Day, groups of pupils and teachers visit a university and circulate in small groups between activities and research studies, with each activity being approximately 25 minutes in length. All pupils participate in all activities and research studies on offer that day – thus there is no selection.
In this study, participant information and parental consent sheets were provided to the schools who dealt with distribution and col- lection of such consent; only pupils with confirmed consent participated.
At the start of the MESS Day, children had research explained to them and were advised that data would be collected, that they had the right to not hand in any forms or sheets, and that their participation was voluntary. This paper is concerned with a single activity delivered multiple times to different children, herein referred to as “gameplay activity.” Each individual instance (there were five or six groups over several days) is referred to as a “session.”
3.2 Apparatus
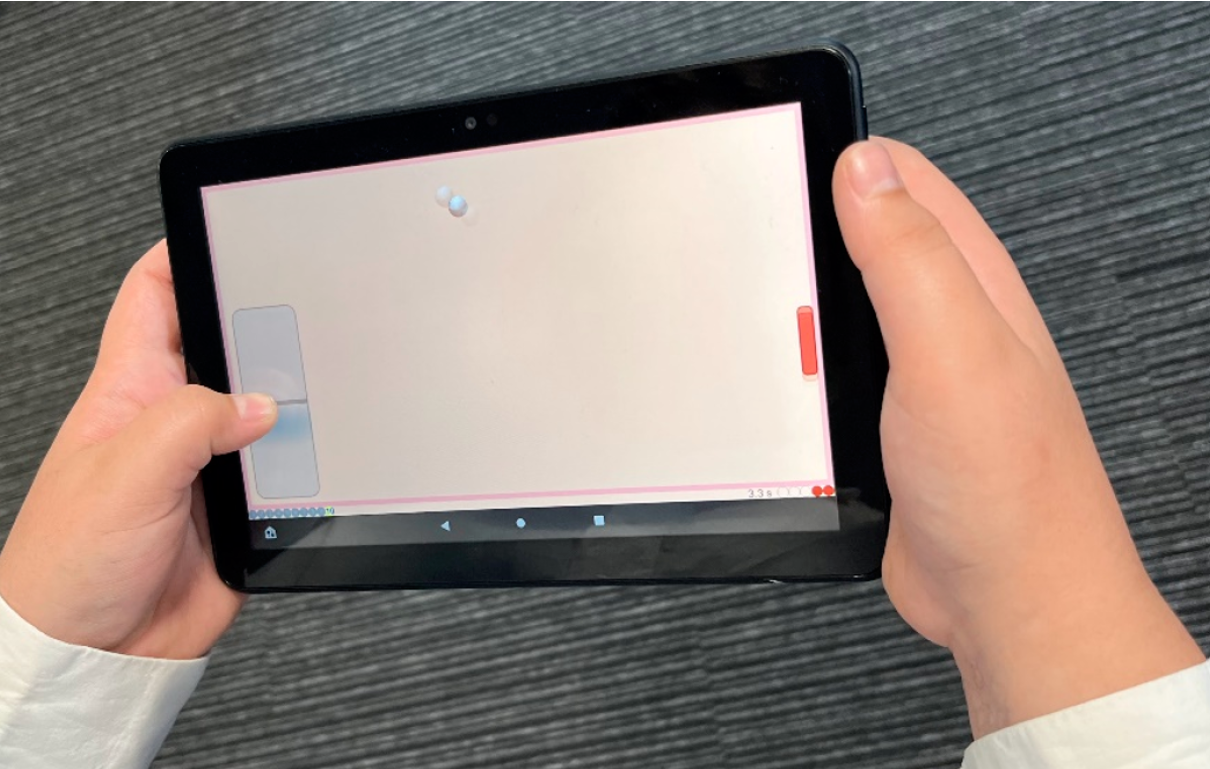
The game was a single player “Pong”-style game played on an Amazon Kindle Fire HD 8 tablet running Fire OS 7.3.2.7 (which is based on Android 9.0). These devices were chosen for convenience as the authors had access to a sufficient number of these identical devices to run the study in groups. The player used touch interaction on the left side of the display to vertically maneuver a paddle on the right side of the display, see Figure 1. The goal was to deflect the ball as it approached the right side of the display.
Figure 1: Picture of a child playing the "Pong" game during the study.
Gameplay was organized in "sequences," with each sequence presenting five back-and-forth movements of the ball. Each sequence lasted approximately 13 seconds (based on the ball velocity and screen size). If the ball was defected five times the player would progress to the next level. If the ball was defected three or four times, play remained on the same level. If the ball was defected less than three times, the player was demoted to the previous level. Gameplay stopped at the end of each sequence and displayed an end-of-sequence dialog box indicating the outcome for the sequence. The three dialog boxes are shown in Figure 2. The user tapped on this dialog to continue with gameplay.
Figure 2: End-of-sequence dialog examples: go back one level (left), stay on current level (middle), and advance to next level (right).
The game consisted of 10 levels. Each level advanced in difficulty in three ways: increasing the velocity of the ball, decreasing the paddle size, and increasing a small random offset in the bounce angle. The game was known to be reliable; it logged player progress during gameplay and had been used successfully in previous research (e.g., [18]).
The game was modified to have three ad conditions with different end-of-sequence behaviours:
- Control – the default behaviour of no ads, described above.
- Ads – a pop-up static interstitial advert appeared before the end-of-sequence dialog appears.
- Video_Ads – a button to watch an advert (in order to remain on the same level) appeared on the end-of-sequence dialog when the ball was defected less than three times. This condition offers the user a choice, either remain on the current level by watching the video advert or go back one level.
The game maintained an indication of current level and game state on the bottom of the screen during gameplay.
3.3 Procedure
At the beginning of each session participants received an identical introduction from the same facilitator. They were asked if they played games on tablets or phones, and, if so, what games they played and was there anything within the games they didn’t like. The response universally being “Ads!”
The game was then explained to them, and a video of the game was shown. The children were told they may find the game difficult and that they were free to stop and take a break if they wished to. The facilitator explained that the game collected anonymous analytics during gameplay (simplified as “like when you go up or down a level and what score you get”) then checked that the participants agreed to these data being collected. Tablets were then handed out and the facilitator ensured that all participants were able to play the game successfully.
After 15 minutes of gameplay the tablets were collected by the facilitator and paper evaluation forms were handed out for the participants to complete. The form asked 18 FunQ questions with responses on a 5-point scale: 1 (never), 2 (rarely), 3 (sometimes), 4 (often), and 5 (all the time), giving a total score range of 18 to 90.1 The questions cover areas of autonomy, challenge, delight, immersion, loss of social barriers, and stress (with three questions in each area) [20]. A few examples are shown in Figure 3.
Figure 3: Examples from the FunQ questionnaire.
For participants in the Ads and Video_Ads conditions, three additional questions were asked: whether the player noticed the advertising, whether advertising made the game better or worse (using the same FunQ 5-point scale), and finally open-ended responses on what they did when encountering an advert and how it made them feel.
The teacher helped assist any children who were struggling to understand or answer the questions. After first checking with each child that they were happy for their answers to be collected and analysed, the facilitator then collected the completed evaluation sheets and thanked all the participants.
3.4 Design
The study was a single-factor between-subjects design with the following independent variable and levels:
- Ad condition: Control (no ads), Ads, Video_Ads
Game flow in the three ad conditions was detailed in the Apparatus section. In the Ads condition, after 10 seconds a cross appeared in the top right-hand corner of the advert allowing it to be dismissed and, if not dismissed, after 20 seconds the advert disappeared. The interstitial adverts were promotional images from the University of Central Lancashire. Five images were included from which one was selected at random when required, an example is seen in Figure 4.
Figure 4: Screen capture of game showing interstitial advert (Ads condition).
In the Video_Ads condition, a cross appeared in the top right-hand corner after 15 seconds allowing it to be dismissed; otherwise, after 30 seconds, the video finished and disappear. Only one video was included in the Video_Ads condition. Again, this was taken from promotional material from the University of Central Lancashire. An example is seen in Figure 5.
Figure 5: Screen capture of game showing video advert (Video_Ads condition).
The design of the Ads and Video_Ads conditions was chosen as an analog of what is found in current free-to-play games; popup interstitial ads that interrupt gameplay, video adverts which offer benefits when viewed, and a small “dismiss” button which appears at the top right of the advert after a timed period for both conditions (as can be seen in Figure 4 and Figure 5). The timings, of when the cross appears and when the advert disappears in the Ads conditions, were chosen based on the authors’ experiences of encountering advertising in a range of mobile games and refined through play-testing.
Although the game software logged a variety of data on player interaction and performance, our analysis is limited to three dependent variables:
- Number of sequences played
- Total active playing time
- Highest game level achieved
Our analysis primarily focuses on the qualitative effect of ads in gameplay. Thus, the response to the FunQ questions along with the informal feedback are of primary concern.
4 RESULTS
Results are presented first by quantitative measures of game performance then by the qualitative responses of the children on their experiences playing the game and on the presence of ads (in the Ads and Video_Ads conditions).
4.1 Game Performance
During gameplay, total active playing time, number of sequences played, and highest level achieved were logged. Data from 95 children were retrieved in log files from the tablet devices across all three conditions. To ensure equal group sizes, the analyses of game performance are limited to 84 logs, or 28 logs for each ad condition – that being the number of log files for the Video_Ads condition. For Control and Ads conditions, files containing the least amount of gameplay data were excluded, as necessary, to balance the groups.
4.1.1 Total Active Playing time
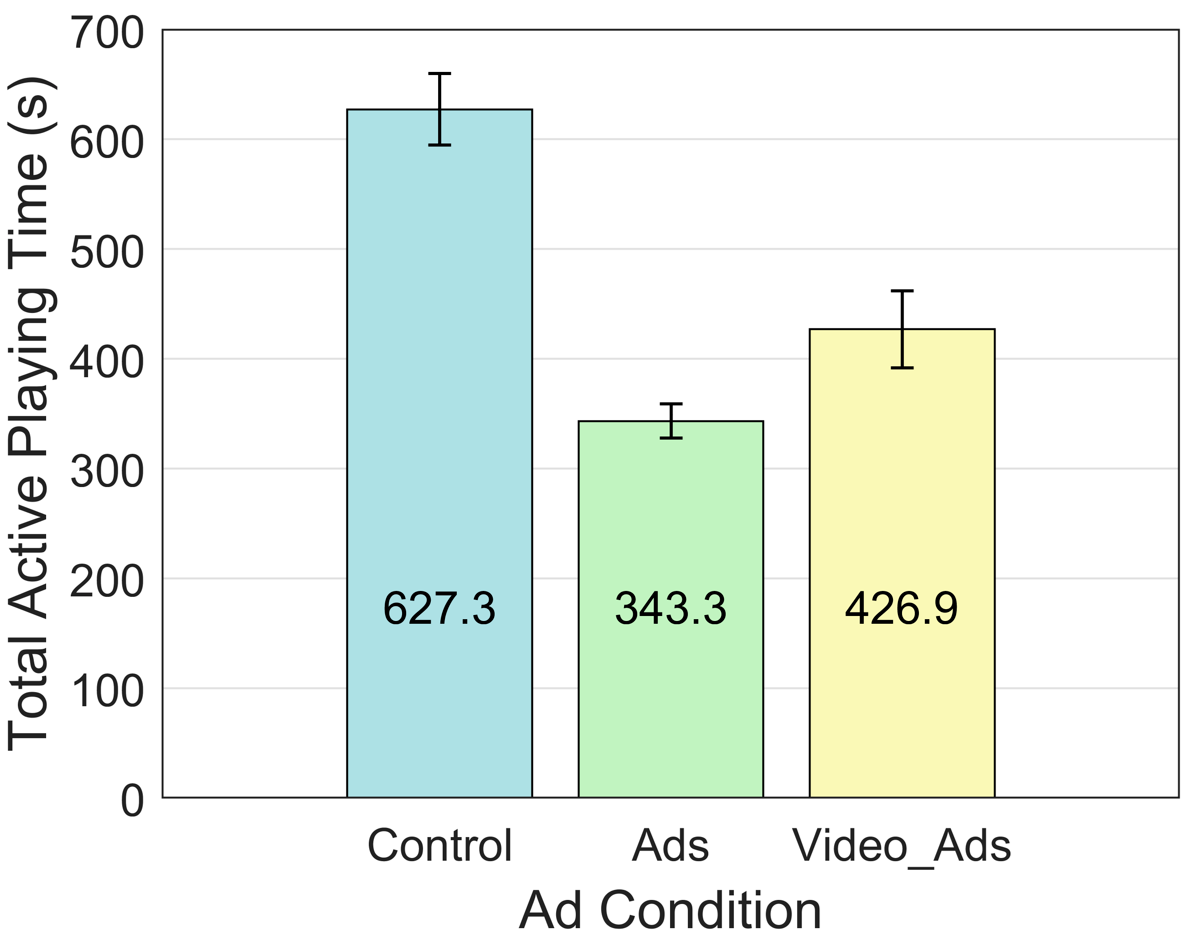
Total active playing time only included active gameplay; it did not include the time watching adverts or the time between one level ending and the next beginning.The total active playing time by ad condition is shown in Figure 6. This was highest in the Control condition (627.3 s, SD = 173.0 s) where there was no possibility for adverts to interrupt gameplay and lowest in the Ads condition (343.3 s, SD = 83.1 s) where game- play was interrupted for at least 10 seconds after each level. The mean playing time in the Video_Ads condition (426.9 s, SD = 184.9) fell between the means of the other conditions and indicates that participants were choosing to watch the video adverts in order to remain on the same level within the game. The differences were statistically significant (F2,81 = 25.2, p < .0001).
Figure 6: Total active playing time (s) by ad condition.
The Video_Ads condition also showed the highest variability in total active game playing time. This is unsurprising since video watching was a choice ofered to players which different players chose to take or not take.
Variability in the total active playing time for the Control condition was similarly high; during the study the facilitator noticed that after long uninterrupted periods of gameplay in this condition some participants took a self-imposed short break (potentially following the instructions at the beginning of the study to do this if they wished). This likely contributed to this result.
4.1.2 Number of Sequences Played
As expected, the number of sequences played is correlated with the total active playing time and yielded the same rankings. By ad condition, the number of sequences was highest for Control (M = 53.3), then Video_Ads (M = 37.1), then Ads (M = 28.9). The differences were statistically significant (F2,81 = 19.7, p < .0001).
4.1.3 Highest Game Level Achieved
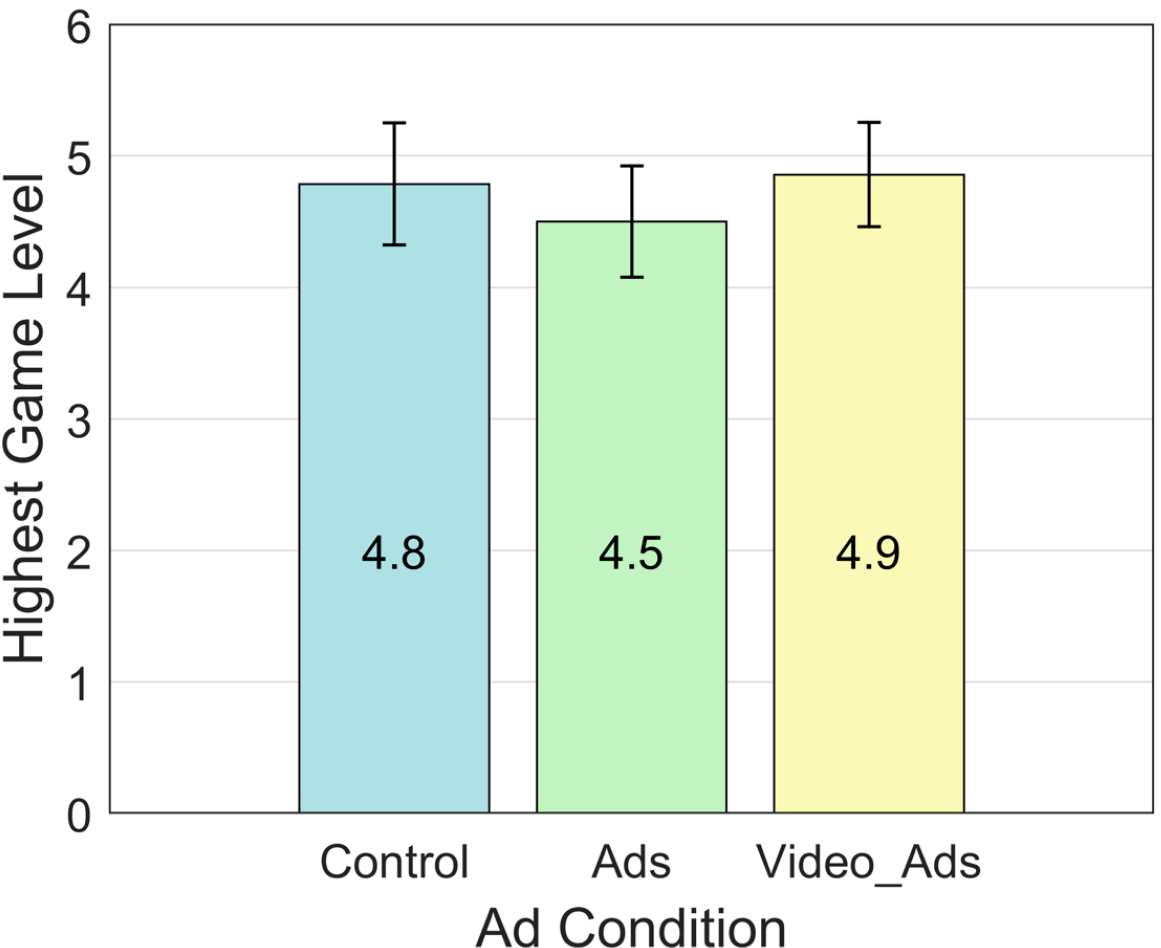
Results for highest level achieved by ad condition are shown in Figure 7. Participants achieved the highest mean level (best performance) in the Video_Ads condition (M = 4.9, SD = 2.1), closely followed by the Control condition (M = 4.8, SD = 2.5), with the lowest performance seen in the Ads condition (M = 4.5, SD = 2.2). The differences were not statistically significant (F2,81 = 0.19, ns).
Figure 7: Highest game level achieved by ad condition.
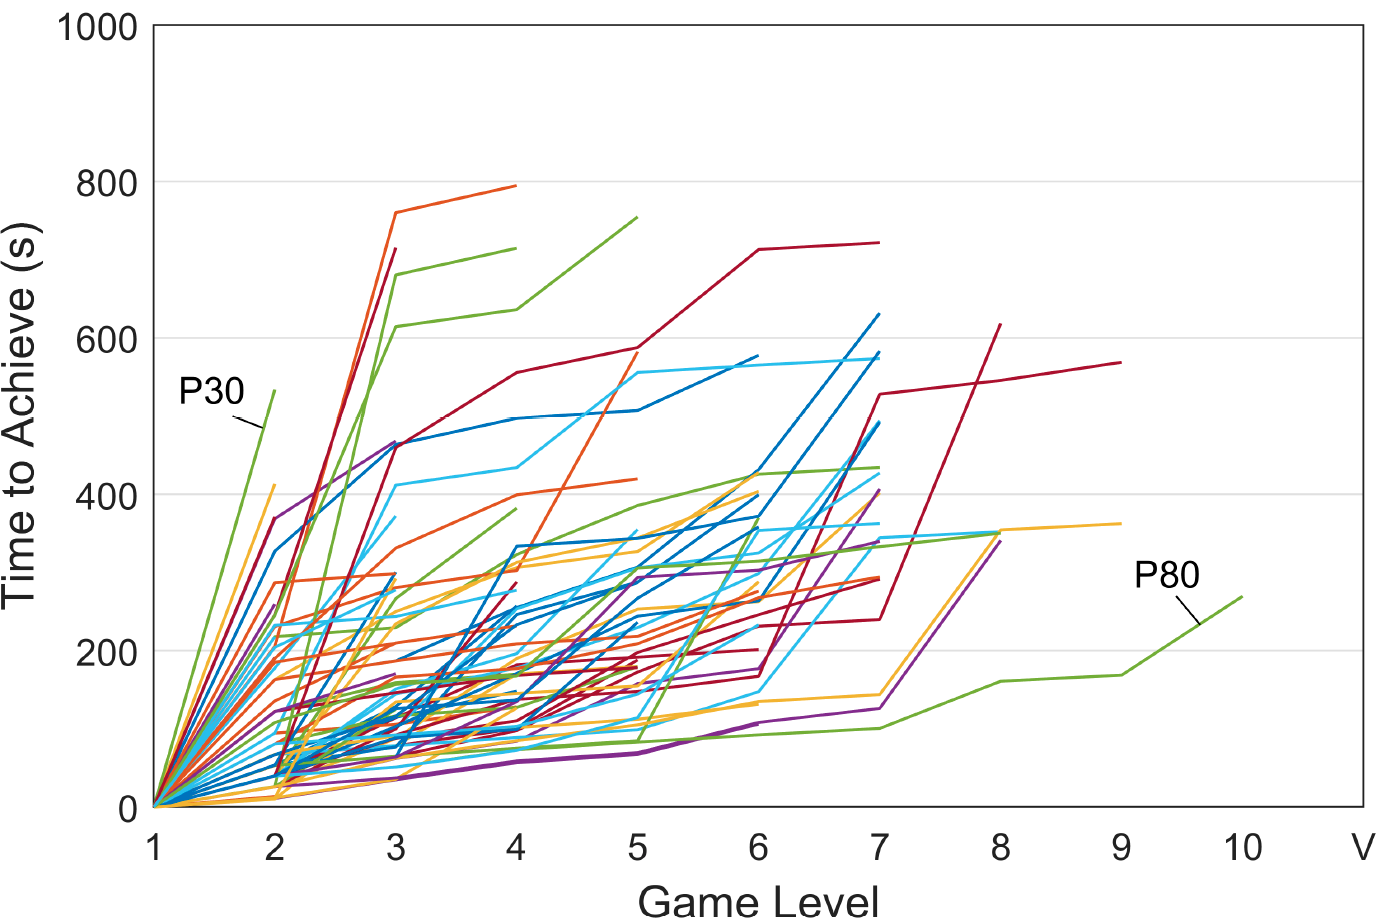
The overall progression in gameplay is shown in Figure 8, where a variety of performance outcomes are evident. One participant, P80, reached level 10 in under 5 minutes (300 s). At the other extreme, P30 took about 9 minutes (540 s) to reach level 2 but did not advance past that level.
Figure 8: Progression in gameplay showing the time to reach a game level.
4.2 Evaluation Form
In total 93 evaluation forms were collected but 15 of these were excluded as they were not filled in completely, giving 31 completed forms for the Control condition, 25 for the Ads condition, and 22 for Video_Ads. The results are shown in Table 1. The highest overall mean score came from the Video_Ads condition (M = 66.9, SD = 16.4), followed by the Control condition (M = 63.0, SD = 13.2) and Ads condition (M = 62.4, SD = 11.8). Although the Video_Ads score was 6.1% higher than the Ads score, the differences were not statistically significant as determined using a Kruskal Wallis non-parametric test (H = 3.38, p = .185).
Table 1: Results from the evaluation form
Ad condition n FunQ Score I noticed adverts
in the gameAdverts made
the game betterAdverts made
the game worseM SD M SD M SD M SD Control 31 63.0 13.2 - - - - - - Ads 25 62.4 11.8 4.6 0.9 1.7 1.3 4.0 1.6 Video_Ads 22 66.9 16.4 4.3 1.3 2.3 1.7 3.7 1.6
In response to the question “I noticed adverts in the game” (using the FunQ 5-point answer scale) the mean scores were > 4.0 in the Ad and Video_Ads conditions, as would be expected.
In response to the question “Adverts made the game better” (again, using the FunQ 5-point answer scale) the scoring in the Ads condition (M = 1.7, SD = 1.3) was lower than the more neutral scoring in the Video_Ads condition (M = 2.3, SD = 1.7). Both means are near 2 (rarely); however, the difference was not statistically significant as determined using a Mann Whitney U text (z = 1.30, p = .194).
In response to the question “Adverts made the game worse” results (using the FunQ 5-point answer scale) showed a slightly higher level of agreement in the Ads condition (M = 4.0, SD = 1.6) compared to the Video_Ads condition (M = 3.7, SD = 1.6). Although the means were about 4 (often), The difference was not statistically significant (z = 1.08, p = .280).
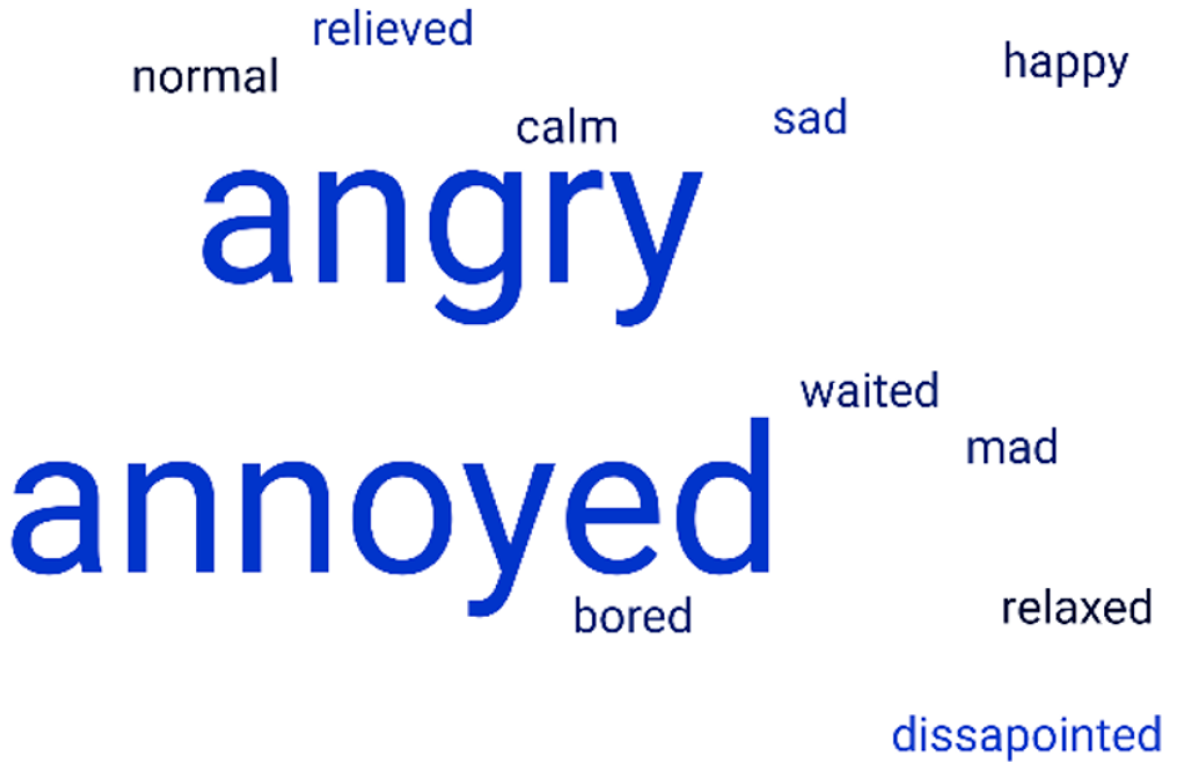
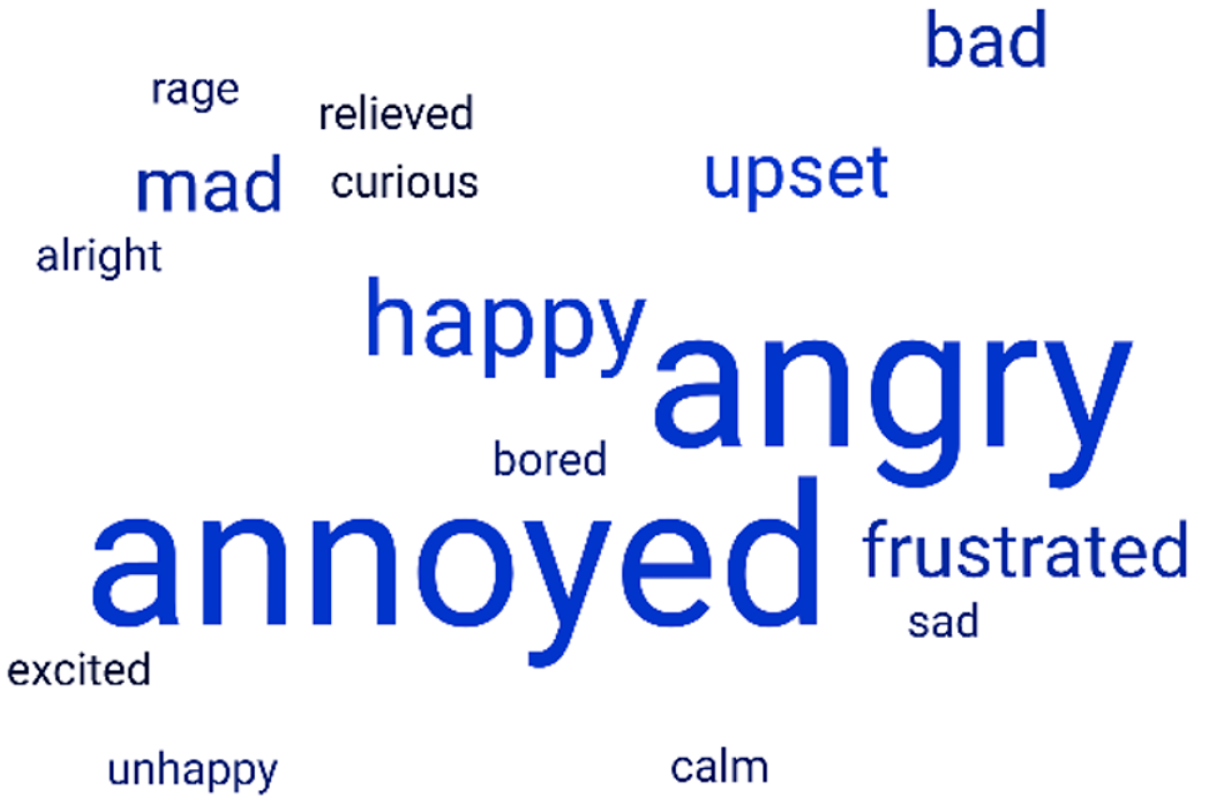
In response to the questions of what participants did when an advert appeared in the game, in the Video_Ads condition answers tended to be very brief and related to waiting (e.g., “I just sat and waited”) or watching the advert (“I watched it”). In the Ads conditions waiting and watching did appear but along with more references to negative emotions (e.g., “Wait angrily” and “Get annoyed”). Similar differences were also apparent in the answers to the question of how participants felt while watching an advert. Figure 9 shows a word cloud (including only words with emotional valence) of responses to this question in the Video_Ads condition and Figure 10 shows the same word cloud from the Ads condition. Comparing Figure 9 and Figure 10, we see that “angry” and “annoyed” are common in both conditions, but we see a wider range of emotionally negative vocabulary appearing for Ads (Figure 10: “rage,” “upset,” “frustrated,” “unhappy,” “bad”) that is not evident for Video_Ads (Figure 9). The word “happy” appears more prominently for Ads (Figure 10, n = 3) than for Video_Ads (Figure 9, n = 1).
Figure 9: Video_Ads condition: Word cloud of responses to question ‘How did you feel when an advert appeared in the game?’
Figure 10: Ads Condition: Word cloud of responses to question "How did you feel when an advert appeared in the game?"
5 REPORTING BACK
After analysing the results of the experiment we were keen to ‘report back’ [15] our findings back to the children that participated. This was in order to help the children further understand the study that they had participated in, in terms of what data had been collected during the study and what we had been able to learn from it. We also sought to understand their experiences of the Reporting Back session and further probe some issues evidenced in the analysis from the study.
5.1 Participants
We were only able to report back to one of the schools that participated in the original study. Two academics visited the school approximately five months after the original study, at this point the child participants had progressed from Year 5 to Year 6 within the UK school system. The Reporting Back session was attended by 43 children and of these 12 had not participated in the original study. This Reporting Back session was part of a larger project which the children had been participating in within their school which had involved both STEM engagement and research work.
5.2 Apparatus
PowerPoint slides were used to present four findings from the results in as simple and concise a way as possible, these findings were expressed as:
- "Less ads = More playing time."
- "Ads did not affect scores."
- "Video_Ads made the game better."
- "Ads made you angry and annoyed."
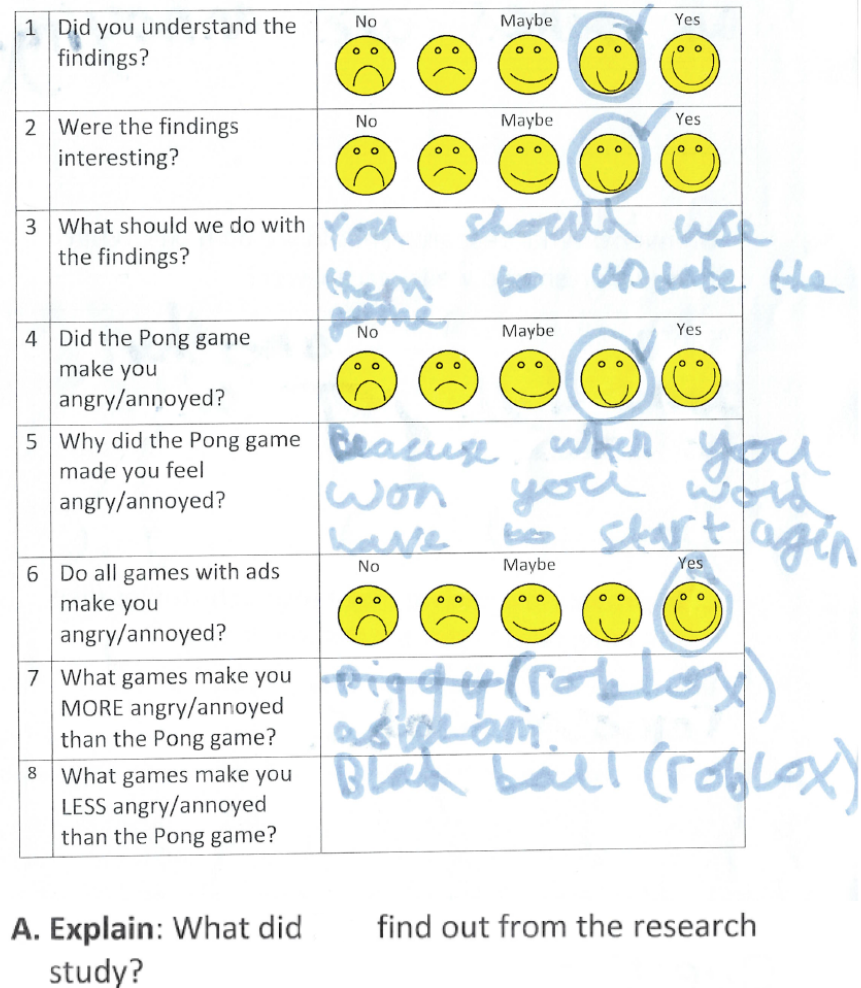
Each finding was presented on a separate slide with illustrative pictures to help aid understanding, for example, for the first findings about playing time we showed the graph from this current paper and a picture of a hand holding a stopwatch. A paper form was created containing the questions we wished to ask the children (see Figure 11 for a completed example showing the questions). The format was similar to that of the Design and Evaluation booklets used previously to understand expectations and experience of design workshops with children in [14]; layout was deliberately simple and a 5-point Smiloyometer scale [16] was used where possible.
Figure 11: Reporting Back sheet
5.3 Procedure
In the Reporting Back session all children were seated within a single large classroom; class teachers and support staff were present but the session was led entirely by the academics. The session began with a class discussion about their visit to the university and explored what they remembered about playing the “Pong” game; it quickly became apparent that pupils had clear recollections of participating in the study and were enthusiastic about sharing their experiences with the class. The academics then asked the children which condition they had played the game in and gave out colour coded evaluation sheets as appropriate (as shown in Figure 11).The class were reminded that data were being collected, that they should not add their name to the sheets, that participation was optional, and that they did not have to give in their sheet at the end of the session if they did not want to. Each side of the sheet was introduced and explained in turn, children then filled in the sheets while academics and teachers circulated around the room assisting any children who had questions. At the end of the session the facilitators collected in the sheets directly from the children, firstly checking that children were happy for their sheets to be collected. 43 completed sheets were collected, and of these 31 were from children who had participated in the gameplay activity.
5.4 Results
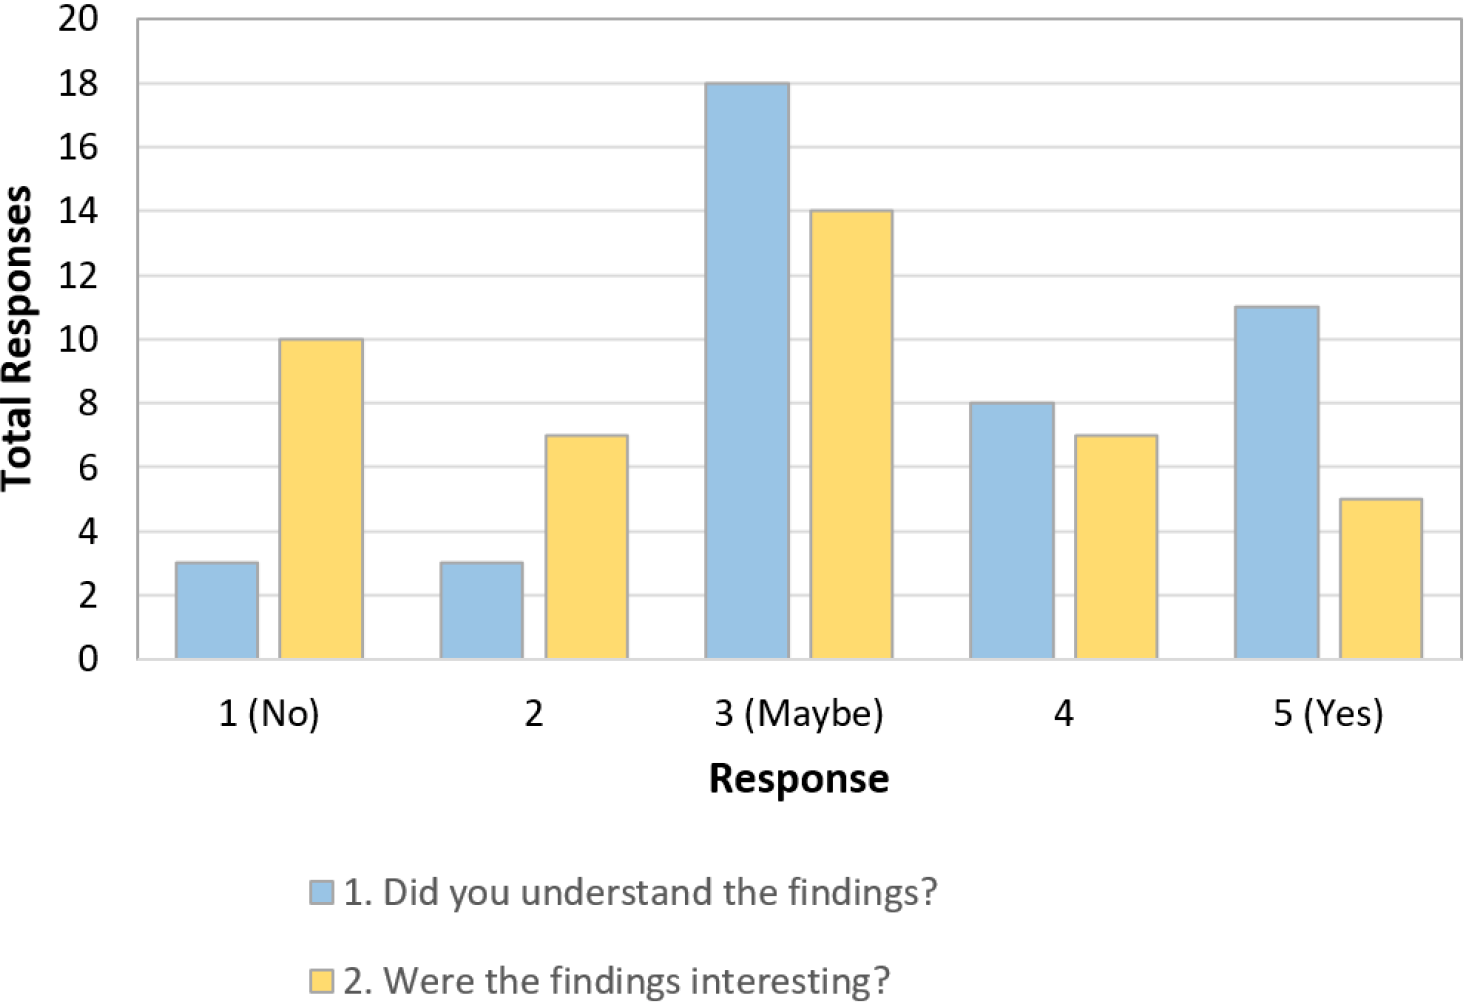
The first two question from the Reporting Back sheet asked about whether the findings presented were understandable (Question 1) and if they were interesting (Question 2). As can be seen from Figure 12 the most popular response to both questions was 3/‘Maybe’, with the second most popular being 1/‘Yes’ for Question 1 (give a mean response 3.51) and 2/‘No’ for Question 2 (giving a mean response of 2.62).
Figure 12: Responses to Reporting Back Questions 1 and 2
Question 3 was an open-ended question asking what should be done with the findings, of the 43 completed sheets only 23 (53%) contained responses that answered the question. In order to analyse the responses Thematic Analysis was carried out by two authors of this paper working together using an open coding approach. Due to the simplicity of the data it was only necessary to apply a single code to each response. In cases of disagreement the interpretation of handwriting was first checked and data then discussed until agreement was reached. The themes are explained with examples in Table 2; while the ‘Use’, ‘Continue’ and ‘Share’ themes are easily understood, ‘Keep’ was more ambiguous, the authors interpreted this as children feeling that the findings should be ‘Kept’ for some unspecified future usage (rather than just being forgotten).
Table 2: Themes from analysis of Question 3 responses
Theme n Description Keep 7 Referred specifically to the findings needing to be ‘kept’ e.g. "I think you should keep them" Use 6 Stated that the findings should be used or applied in some way e.g. "You should use them to update the game" Continue 5 Implied further work should be carried out in relation to the findings e.g. "We should learn more about the findings" Share 5 Referred to ideas for sharing the finding more widely e.g. "Show the world how ads affect games"
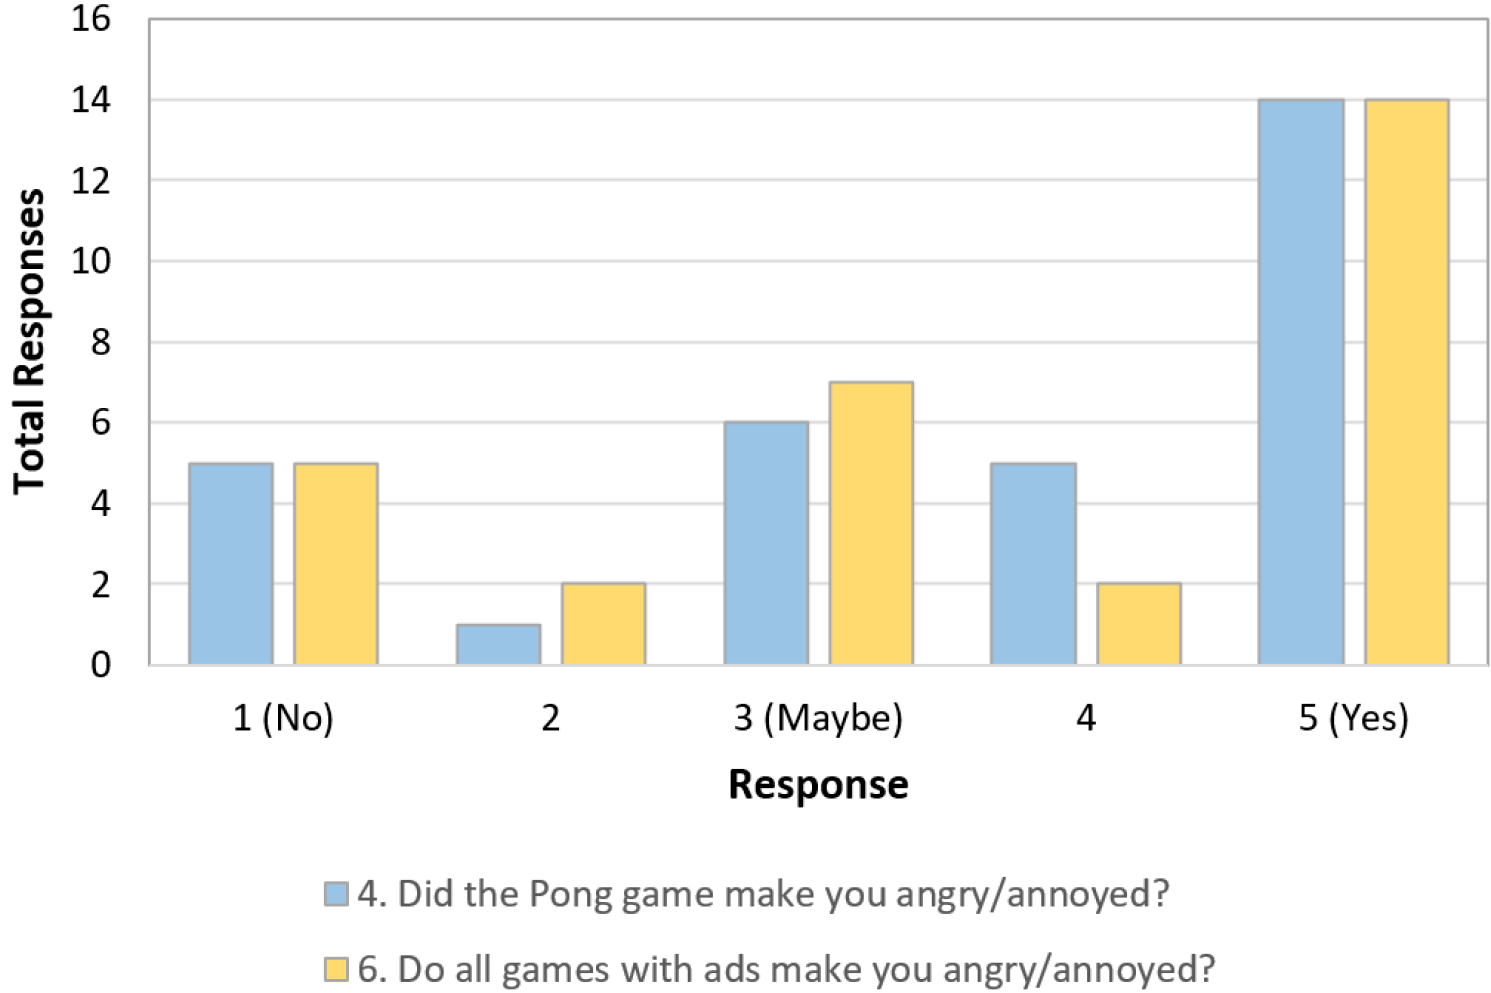
Question 4 sought to confirm the finding that our “Pong” game made the participants angry and annoyed, and question 6 was intended to probe whether all games with ads created this response. Only the 31 responses from participants that reported participating in the gameplay activity were analysed. Figure 13 shows that for both Questions 4 and 6 ‘Yes’ was the most popular response (with 45% of responses for each question), giving means of 3.70 and 3.57 respectively. Kruskal-Wallis tests were performed on the responses from the three conditions (Control, Ads and Video_Ads) for Questions 4 and 6. The difference between the conditions was not significant in either case (for Question 4, H = 1.601, p = 0.4491, for Question 6, H = 1.500, p = 0.4723).
Figure 13: Responses to Reporting Back Questions 4 and 6
Question 5 was intended to gather additional insights into the responses to Question 4 and asked "Why did the ‘Pong’ game made you feel angry/annoyed?" Responses were analysed in the same way as Question 3, of the 31 response sheets from all three conditions 22 (71%) contained responses that answered the question. The themes are shown in Table 3. As expected, only participants from the Ads and Video_Ads condition included responses aligning with the ‘Ads’ theme. The ‘Progress’ and ‘Gameplay’ themes highlight the difficulty some participants had succeeding and progressing in the game. As seen from Figure 7 and Figure 8, the mean game level achieved was <5 (out of 10) and very few participants progressed beyond level 7.
Table 3: Themes from analysis of Question 5 responses
Theme n Description Ads 7 These explanations referred to advertising within the “Pong” game e.g., "Because there was a lot of ads" Progress 7 These responses implied that the player was struggling to make progress between levels in the game e.g., "Because I couldn’t get to a level" Gameplay 3 This referred to aspects within the gameplay which were intentional but participants did not enjoy e.g., "Because when you won you would have to start again" Bugs 3 This referred to elements that were perceived as bugs or glitches within the game e.g., "Sometimes it didn’t work"
The ‘Bugs’ theme was interesting in that it fagged potential problems with the game or tablet device experienced during the study. No problems in this regard were noticed during the study sessions and detail in responses was too brief to fully understand what was being referred to. From responses to Questions 7 and 8 participants were able to identify digital games that made them more angry/annoyed than our “Pong” game and other digital games that made them more angry/annoyed, this data was not analysed in further detail as it was often unclear what specific game was being referred to or even what platform it was being played on.
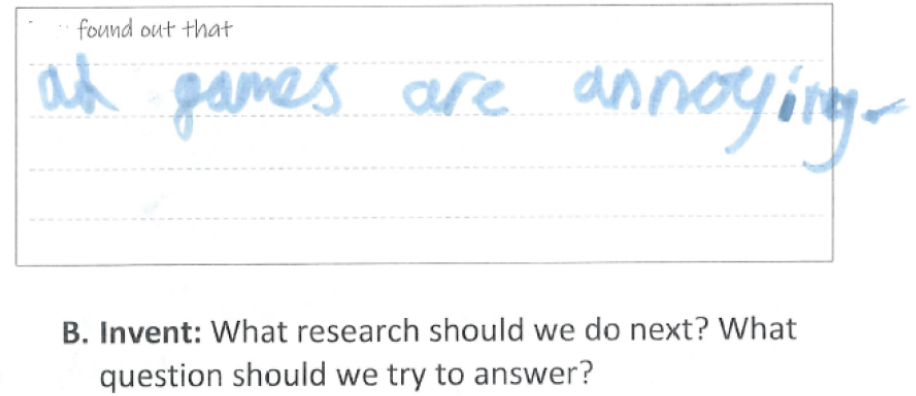
The final three questions on the Reporting Back sheet (Figure 11) asked children to explain what was found in the study (Question A), invent a new idea for further research (Question B), and provide ideas to improve further research studies (Question C). A collaborative coding approach was used to analyse the responses. For each question two of the authors familiarised themselves with the responses and agreed a set of appropriate codes, the coders then worked through the data together applying codes as appropriate. There were no instances of disagreement and only a single code was required for each response. All 43 completed sheets were considered. For Question A (explain) 20 (47%) relevant responses were considered for analysis (the rest being either blank, stating "I don’t know" or mentioning something irrelevant). Of these 20, 12 (60%) responses were coded as showing a Good understanding of at least one of the findings, typically re-stating or paraphrasing the finding; e.g., "The ads made us upset or mad". The remaining eight (40%) were coded as having a Partial understanding of at least one finding, typically stating something that was closely related to a finding but somewhat unspecific e.g., "That people don’t like ads". For Question B (invent) 19 (44%) responses were considered for analysis with three codes being evident:
- Research Questions (n = 8) Included a range of clearly articulated questions which could be explored through research e.g., "What is better wafers or pancakes?", "How many children enjoy games?", "How many sea creatures die because of litter?"
- Research Ideas (n = 6) Included potential ideas for research which were often unspecific e.g., "Fixing illness", "Do how to remove ads", "Create another game with even more ads".
- STEM Projects (n = 5) Included ideas which could work well as STEM-based learning and enquiry projects in school; e.g., "How the wifi works", "Why is the end of the universe a web", "How do you make a TV?"
The results of Question C (improve) are not presented in this paper as they related only to suggestions for the “Pong” game (primarily removing the adverts).
6 DISCUSSION
From the answers to the open-ended questions (particularly “How did you feel when an advert appeared in the game?”), it is clear that encountering advertising within the game was often negative in both the Ads and Video_Ads conditions. This is evident from the multiple occurrences of “angry” and “annoyed” in Figure 9 and Figure 10. There is a wider range of negative feelings in the Ads condition which is perhaps due to the regular and unavoidable interruption in gameplay in that condition. In the Ads condition responses to the question “Adverts made the game worse” yielded a mean of 4.0 (SD = 1.6), corresponding to often (4) on the answer scale, while in the Video_Ads conditions the mean response was slightly less negative, closer to sometimes (3) on the answer scale, at 3.7 (SD = 1.6).
Similar differences between these conditions were also apparent in the responses to the question “Adverts made the game better” where, in the Video_Ads condition, the mean response was 2.3 (SD = 1.7), falling between rarely (2) and sometimes (3) on the answer scale, and was 1.7 (SD = 1.3) in the Ads condition, between rarely (2) and never (1). It should be noted that this study was a between-subjects design, so participants in the Ads and Video_Ads conditions did not experience playing the game without any adverts. Since the question used comparative words (e.g., better and worse) the responses are somewhat hypothetical since participants were only exposed to one condition.
The experience slightly improved in the Video_Ads condition. This is evident in the overall FunQ scores, with the Video_Ads scoring highest (M = 66.9, SD = 16.4) of all three conditions, and the Ads condition scoring lowest (M = 62.4, SD = 11.8).
While the results from this paper suggest that the Ads condition provided participants with the least-positive experience of the three conditions, the results in Figure 6 and Figure 7 show that the difference is small. One important difference is the impact of the Ads and Video_Ads conditions on total active playing time. Within the Ads condition this was 343.3 s (SD = 83.1) while in the Control condition this was far larger at 627.3 s (SD = 173.0). The large difference occurred because in the Ads condition, the game displayed a static interstitial advert for about half the overall time allocated to the study. This was an intentional part of the study design as it reflects the reality of playing free-to-play mobile games. From the FunQ analysis, the Video_Ads condition scored higher than the Control condition (without any adverts). Viewing the advert with the Video_Ads was optional for the user and offered a tangible benefit within the game (i.e., remaining on the same level instead of being demoted to a lower level), and this likely contributed to the higher level of experienced fun. This explanation is potentially supported by results of the quantitative analyses of game performance shown in Figure 6 and Figure 7. In the Video_Ads condition participants achieved the highest mean level (M = 4.9, SD = 2.1) in a mean active playing time of 426.9 s (SD = 184.9), while in the Control condition the mean highest score was very slightly lower (M = 4.8, SD = 2.5) but the mean active playing time was a far higher 627.3 s (SD = 173.0). This shows that in the Video_Ads condition players were able to progress within the game to the same, or even better, extent as in the Control condition despite the players in the Video_Ads condition spending on average 32% less time playing the game.
The Reporting Back session was important in developing child participants’ understandings of the research that they had participated in; quantifying the impact of this activity was something that had not been attempted previously and, amid concerns over how meaningful findings from the study would be to the children, and how well children would be able to provide insights retrospectively (as using retrospective methods used with children is known to be challenging, e.g., [22]) this study gives some important insights and is an important increment from the work reported in [15].
From the responses to the first three questions on the Reporting Back sheet (Figure 11) it was clear that most children felt they had some level of understanding of the findings and were able, in many cases, to provide appropriate ideas for what should be done with these findings. Question A was intended as further check on how well findings had been understood and the 20 responses given showed a good or partial understanding (corresponding closely with the 19 positive responses of point 4 or 5 on the Smileyometer scale to Question 1 shown in Figure 12). However, the results did suggest that the findings presented were not actually of interest to the children.
Questions 4 and 5 on the Reporting Back sheet were valuable in both confirming the findings highlighted in Figure 10 and Figure 9 (as demonstrated by the high ‘yes’ response in Figure 12) and gathering additional insights into why the game created the feelings of anger and annoyance (as shown in Table 3). Responses to Question 5 referred to both to adverts and other aspects within the game play (including lack of progress, game play design, and apparent bugs in the game as shown in Table 3), it should be noted that questions used to gather the data for Figure 10 and Figure 9 refereed specifically to the appearance of adverts while Question 5 from the Reporting Back sheet enquired about anger/annoyance within the game play more generally.
Questions 6, 7, and 8 were used to explore whether the “Pong” game was particularly frustrating to play or whether feelings of anger/annoyance were similar in other games with advertising. The majority ‘yes’ response to Question 6, as shown in Figure 12, suggests that participants generally found all games including ads made them angry/annoyed; the fact that responses to Questions 7 and 8 gave examples of other games that were both better and worse than the “Pong” game (in terms of creating anger and annoyance) both help to support these findings and suggest that children may be able to rank games using this as a criteria. The most unexpected insights emerged from Question B ("Invent: What research should we do next? What questions should we try to answer?") where the authors were surprised at the sophistication shown by the children in articulating research questions, the novelty shown within the research ideas, and the appropriateness of the suggested STEM-projects as topics for exploration within a classroom context. These all exceeded the authors’ expectations and highlight the value of working with children of this age in co-designing research projects.
7 LIMITATIONS
FunQ was chosen as it has been shown to be internally consistent and measures a range of factors related to experienced fun [20]. A potential weakness of this tool is the single overall score which may hide interesting changes in the six constituent fun factors (autonomy, challenge, delight, immersion, loss of social barriers and stress) which, if exposed, could help provide explanations on what contributed to the differing scores between the three conditions reported in this paper. FunQ has been developed for, and used within, collaborative classroom contexts (e.g., [19, 21]) and factors such as autonomy and loss of social barriers may not be relevant for evaluating fun in individual gameplay.
Another limitation of this study is that a small number of participants struggled to progress onto even the second level of the game; the facilitator observed these participants struggling to understanding how to position the paddle to defect the ball and/or struggling to manage the touch-interaction required to change the position of the paddle (even after being given help by the facilitator and teacher). This problem could have been compounded when peers sitting nearby exclaimed out loud in triumph when progressing through levels. For these participants struggling with gameplay, their experience may not have been positive, regardless of condition, and could explain the responses in Figure 9 and 10 suggesting that some participants were happier while watching adverts. Evidently, for some participants this was a welcome alternative to playing the game. It is difficult to speculate what influence awareness of others in physical proximity playing the same game could have had on results, in future work this is something we plan to consider within study design.
A limitation of the Reporting Back session was that it was only possibly to conduct this with a subset of the children that participated in the larger Pong study. Analysis of the responses highlighted areas for improvement in the phrasing of the questions, for example Question 5 may have gathered more insights if it had referred specifically to adverts within the game (rather than the game more generally), and Questions 7 and 8 should ideally have probed more specifically into the games listed as answers. Another limitation is the fact that only around half of participants provided clear responses to the open-ended questions, in these cases it is not possible to know if the child did not understand the question, had nothing they were able to articulate, or just decided that they did not want to share their answer. It is important to note that during the session the children were told they did not have to answer any question if they did not want to.
8 CONCLUSION
While the free-to-play model using advertising for monetization has proved both popular and successful in the mobile-games industry, the impact on player experience is not well understood. This research explored the impact of advertising-based monetization on player experience and performance within a mobile-game. Findings were reported from a between-subjects study involving 95 children 9-11 years old playing a single-player “Pong”-style game. Play proceeded using one of three conditions: Control (no adverts), Ads (interstitial static advert shown at the end of each level) and Video_Ads (video advert optionally watched in order to remain on the same level in the game).
Data collected included an evaluation form completed after gameplay and analytics collected during gameplay. Results showed that the impact of the Ads and Video_Ads conditions on player experience and player performance was nuanced. The Ads condition showed the lowest reported fun experience (using FunQ), the lowest player performance, triggered the widest variety of negative feelings, and received the most positive response to the question “Adverts made the game worse” (although only small differences in results between the three conditions were found). We attribute this result to the regular and unavoidable interruption in gameplay in this condition.
The Video_Ads condition showed the highest reported fun experience (using FunQ) along with the best performance within the game, both results being higher than the Control condition with no advertising. We attribute this result to the mechanism within the Video_Ads condition that allowed players to receive a tangible benefit, avoiding being demoted to a lower game level, and the agency players had in choosing whether to watch the advert or not. After analysis, and following our own work [15], findings were ‘reported back’ to a subset of children who participated in the larger study, this involved presenting the key findings in a simplistic way and using a questionnaire to probe understanding of the findings and gather additional insights. This proved to be a valuable process which showed that the majority of children reported that they had some level of understanding of the findings.
The questionnaire results also helped to provide additional insights into the findings from the larger study and highlighted the ability of this age group to contribute their own unique ideas to possible future research directions. We were also able to reflect on this process which will improve how we ‘report back’ later studies. While this study is situated within a single mobile game and user population, we feel that our results make two valuable contributions to academic and practitioner communities. The first contribution is to show that interstitial static pop-up advertising within mobile games can have a negative impact on player experience and player performance. The second contribution is that appropriately designed advertising-based monetization can have a positive impact on player experience and player performance.
We hope these findings may inspire mobile game designers, developers, and publishers to consider carefully how advertising-based monetization is deployed within their products and how it can be used to provide a more positive impact on player experience through a shift to a more equitable paradigm – allowing the player agency in engaging with advertising and ensuring the benefits of such are apparent. We would also encourage others with the IDC community to also consider our Reporting Back process as a way both to help children develop deeper understandings of the research they have participated in and as a tool to gather additional insights.
9 SELECTION AND PARTICIPATION OF CHILDREN
This work was conducted with entire school classes of children and, as such, the researchers had no direct role in the selection of children that participated. Information and parental consent sheets were created by the researchers, approved via the appropriate university ethical approval process, and provided to the school who sought consent from parents and ensured only children with consent participated. All data was collected anonymously. Prior to participation the researchers explained to children what data was going to be collected and explained that they did not have to share their data with the researchers if they did not want to, the researchers also checked with children again after participation when collecting in completed question sheets.
REFERENCES
[1] Appbrain. 2023. Number of available Android applications. https://www.appbrain.com/stats/free-and-paid-android-applications. [Online: accessed: Nov 6, ’23].
[2] Gil Appel, Barak Libai, Eitan Muller, and Ron Shachar. 2020. On the monetization of mobile apps. International Journal of Research in Marketing 37, 1 (2020), 93–107. https://doi.org/10.1016/j.ijresmar.2019.07.007
[3] Kerstin Bongard-Blanchy, Arianna Rossi, Salvador Rivas, Sophie Doublet, Vincent Koenig, and Gabriele Lenzini. 2021. ”I am definitely manipulated, even when I am aware of it. It’s ridiculous!” - Dark patterns from the end-user perspective. In Proceedings of the ACM Designing Interactive Systems Conference – DIS ’21. ACM, New York, 763–776. https://doi.org/10.1145/3461778.3462086
[4] Harry Brignull. 2013. Dark patterns: Inside the interfaces designed to trick you. The Verge. https://www.theverge.com/2013/8/29/4640308/dark-patterns-inside-the-interfaces-designed-to-trick-you [Online; accessed Nov 6, ’23].
[5] Linda Di Geronimo, Larissa Braz, Enrico Fregnan, Fabio Palomba, and Alberto Bacchelli. 2020. UI dark patterns and where to find them: A study on mobile applications and user perception. In Proceedings of the ACM SIGCHI Conference on Human Factors in Computing Systems – CHI ’20. ACM, New York, 1–14. https: //doi.org/10.1145/3313831.3376600
[6] Dan Fitton and Janet C. Read. 2019. Creating a framework to support the critical consideration of dark design aspects in free-to-play apps. In Proceedings of the 18th ACM International Conference on Interaction Design and Children – IDC ’19. ACM, New York, 407–418. https://doi.org/10.1145/3311927.3323136
[7] Colin M. Gray, Jingle Chen, Shruthi Sai Chivukula, and Liyang Qu. 2021. End user accounts of dark patterns as felt manipulation. Proceedings of the ACM on Human-Computer Interaction CSCW2, 5, Article 372 (oct 2021), 25 pages. https://doi.org/10.1145/3479516
[8] Hana Habib, Megan Li, Ellie Young, and Lorrie Cranor. 2022. “Okay, Whatever”: An evaluation of cookie consent interfaces. In Proceedings of the ACM SIGCHI Conference on Human Factors in Computing Systems – CHI ’22. ACM, New York, Article 621, 27 pages. https://doi.org/10.1145/3491102.3501985
[9] Matthew Horton, Janet C. Read, Emanuela Mazzone, Gavin Sim, and Daniel Fitton. 2012. School friendly participatory research activities with children. In Extended Abstracts of the ACM SIGCHI Conference on Human Factors in Computing Systems – CHI ’12. ACM, New York, 2099–2104. https://doi.org/10.1145/2212776.2223759
[10] Chiara Krisam, Heike Dietmann, Melanie Volkamer, and Oksana Kulyk. 2021. Dark patterns in the wild: Review of cookie disclaimer designs on top 500 German websites. In Proceedings of the 2021 European Symposium on Usable Security – EuroUSEC ’21. ACM, New York, 1–8. https://doi.org/10.1145/3481357.3481516
[11] Arunesh Mathur, Mihir Kshirsagar, and Jonathan Mayer. 2021. What makes a dark pattern... Dark? Design attributes, normative considerations, and measurement methods. In Proceedings of the ACM SIGCHI Conference on Human Factors in Computing Systems – CHI ’21. ACM, New York, Article 360, 18 pages. https://doi.org/10.1145/3411764.3445610
[12] Midas Nouwens, Ilaria Liccardi, Michael Veale, David Karger, and Lalana Kagal. 2020. Dark patterns after the GDPR: Scraping consent pop-ups and demonstrating their influence. In Proceedings of the ACM SIGCHI Conference on Human Factors in Computing Systems – CHI ’20. ACM, New York, 1–13. https://doi.org/10.1145/ 3313831.3376321
[13] Elena Petrovskaya and David Zendle. 2022. Predatory monetisation? A categorisation of unfair, misleading and aggressive monetisation techniques in digital games from the player perspective. Journal of Business Ethics 181 (2022), 1065–1081. https://doi.org/10.1007/s10551-021-04970-6
[14] Janet Read, Marta Kristin Larusdottir, Anna Sigríður Islind, Gavin Sim, and Dan Fitton. 2022. Tick Box Design: A bounded and packageable co-design method for large workshops. International Journal of Child-Computer Interaction 33 (2022), 100505. https://doi.org/10.1016/j.ijcci.2022.100505
[15] Janet Read, Gavin Sim, Matthew Horton, and Dan Fitton. 2022. Reporting back in HCI work with children. In Proceedings of the 21st Annual ACM Interaction Design and Children Conference (Braga, Portugal) (IDC ’22). ACM, New York, 517–522. https://doi.org/10.1145/3501712. 3535279
[16] Janet C. Read. 2008. Validating the Fun Toolkit: An instrument for measuring children’s opinions of technology. Cognition, Technology & Work 10, 2 (01 Apr 2008), 119–128. https://doi.org/10.1007/s10111-007-0069-9
[17] Statista. 2023. Mobile Games – Worldwide. Statista. https://www.statista.com/ outlook/dmo/digital-media/video-games/mobile-games/worldwide [Online: accessed: Nov 6, ’23].
[18] Robert J. Teather and I. Scott MacKenzie. 2014. Comparing order of control for tilt and touch games. In Proceedings of the 10th Australasian Conference on Interactive Entertainment – IE ’14. ACM, New York, 1–10. https://doi.org/10.1145/2677758. 2677766
[19] Gabriella Tisza and Panos Markopoulos. 2021. Understanding the role of fun in learning to code. International Journal of Child-Computer Interaction 28 (2021), 100270. https://doi.org/10.1016/j.ijcci.2021.100270
[20] Gabrielly Tisza and Panos Markopoulos. 2023. FunQ: Measuring the fun experience of a learning activity with adolescents. Current Psychology 42 (2023), 1936–1956. Issue 3. https://doi.org/10.1007/s12144-021-01484-2
[21] Gabriella Tisza, Kshitij Sharma, Sofa Papavlasopoulou, Panos Markopoulos, and Michail Giannakos. 2022. Understanding fun in learning to code: A multi-modal data approach. In Proceedings of the 21st Annual ACM Interaction Design and Children Conference – IDC ’22. ACM, New York, 274–287. https://doi.org/10.1145/ 3501712.3529716
[22] Jorick Vissers, Lode De Bot, and Bieke Zaman. 2013. MemoLine: Evaluating long-term UX with children. In Proceedings of the 12th International Conference on Interaction Design and Children - IDC ’13. ACM, New York, 285–288. https://doi.org/10. 1145/2485760.2485836
[23] José P. Zagal, Stafan Björk, and Chris Lewis. 2013. Dark Patterns in the Design of Games. Digitala Vetenskapliga Arkivet. https://www.diva-portal.org/smash/ record.jsf?pid=diva2%3A1043332&dswid=9769 [Online: accessed: Nov 6, ’23].
-----
Footnotes:
1 Four questions use reverse scoring with the raw score inverted in computing the total score.
