The SIMAVR package is for simulating AVR processors like the ATMEGA328 on the Arduino UNO. I'm looking to try to use it with VPL in courses like our computer architecture class, EECS 2021, as a way of simulating the UNO's processor in exercises involving assembler and C programming.
On a Mac, we use HomeBrew. The instructions for downloading SIMAVR as well as GCC and GDB are here: https://kona.moe/installation-of-avr-toolchain-gtkwave-and-gnu-debugger-gdb-on-m1-macbooks/
The "home-brew" AVR package homepage is here: https://github.com/osx-cross/homebrew-avr .
Here's a walkthrough with an example project: https://web.archive.org/web/20200814070955/https://aykevl.nl/2020/06/simavr-debug (original)
Here's an example of using SIMAVR with breakpoints within GDB: https://blog.oddbit.com/post/2019-01-22-debugging-attiny-code-pt-1/
When installing GDB it's important to note this :
gdb requires special privileges to access Mach ports.
You will need to codesign the binary. For instructions, see:
https://sourceware.org/gdb/wiki/BuildingOnDarwin
On 10.12 (Sierra) or later with SIP, you need to run this:
echo "set startup-with-shell off" >> ~/.gdbinit
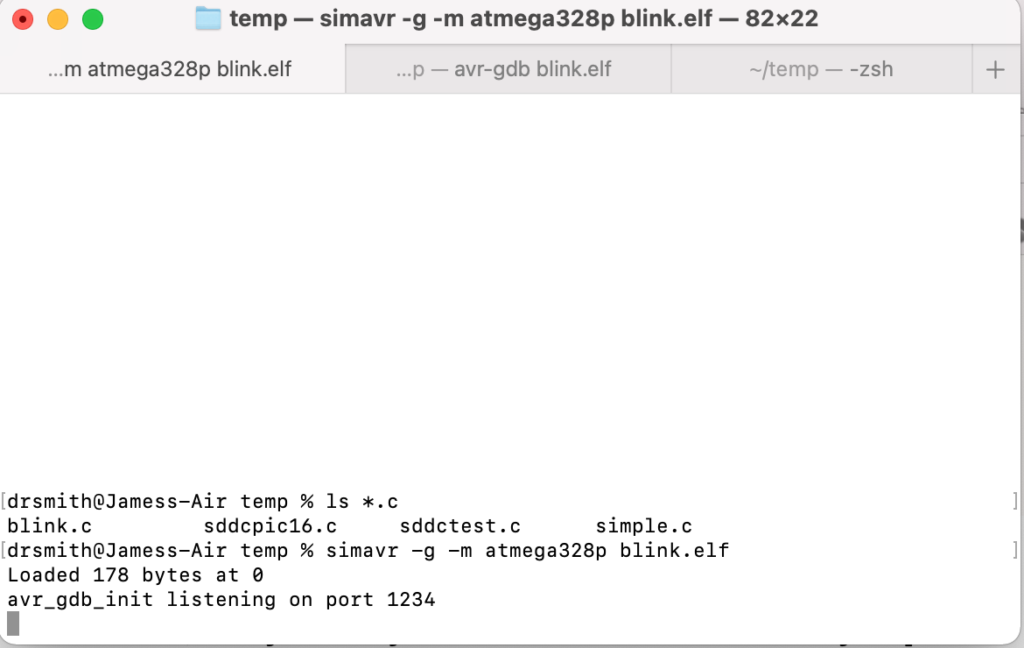
Firing up the simulator:
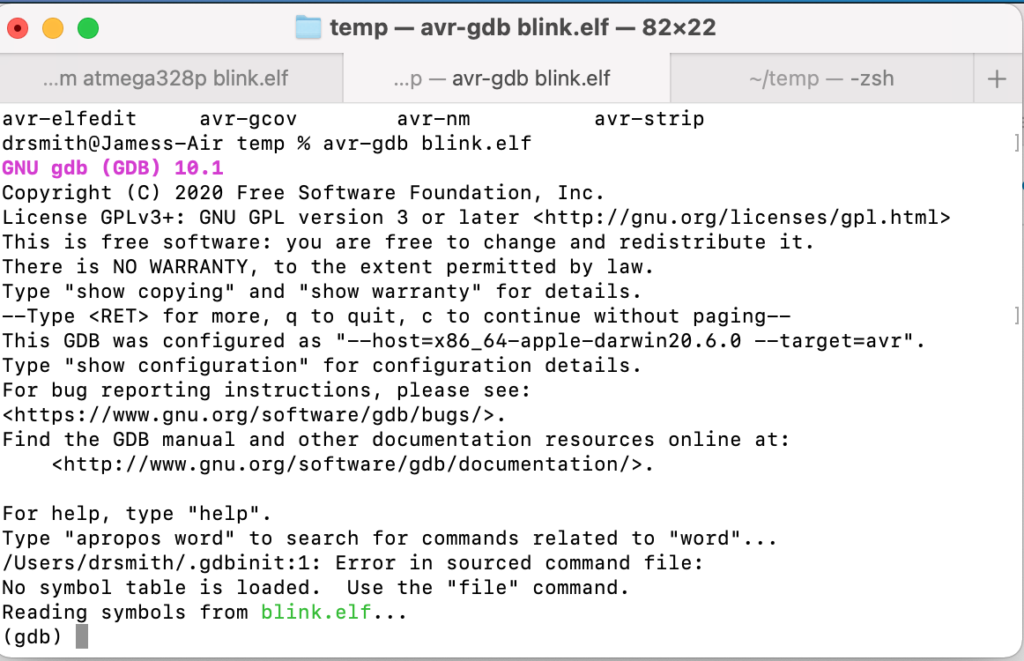
Then firing up the debugger interface:
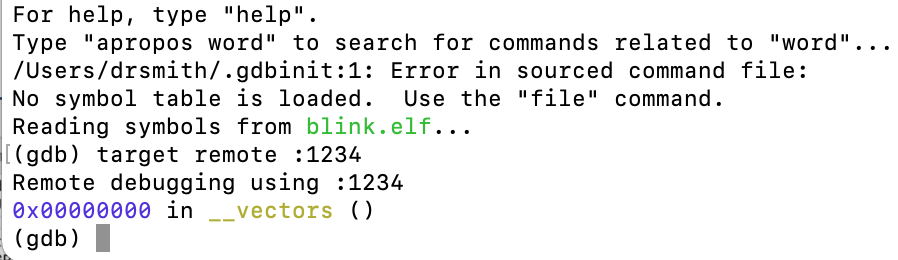
Now connect with the simulator
Now, the next stage will be to see if we can integrate unit testing with this. (e.g https://maddevs.io/blog/avr-mcu-testing/)
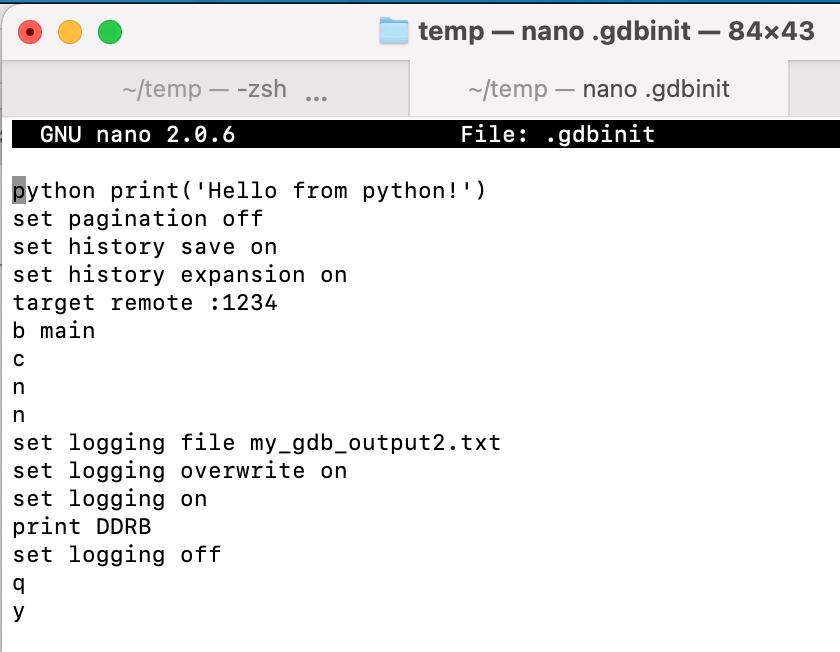
More info on GDB scripting: https://developers.redhat.com/blog/2021/04/30/the-gdb-developers-gnu-debugger-tutorial-part-1-getting-started-with-the-debugger#starting_gdb
and to output only print statements to a file: And if you want the output to go only to the log file, use set logging redirect on (https://stackoverflow.com/questions/5941158/gdb-print-to-file-instead-of-stdout)
here, we capture the contents of an AVR register in a file after a certain number of steps following a breakpoint: