3.2 Smoothing of the Term Structure
The term structure is a function ![]() from the time domain to the interest rate domain i.e., the argument of the function is a time and the value of the function is the spot interest rate at that time. A realistic market requires the knowledge of the discount factors and of the spot rates, not only for times one, two, and three, as in our examples, but for every possible
from the time domain to the interest rate domain i.e., the argument of the function is a time and the value of the function is the spot interest rate at that time. A realistic market requires the knowledge of the discount factors and of the spot rates, not only for times one, two, and three, as in our examples, but for every possible ![]() in some interval
in some interval ![]() . Sometimes the value of
. Sometimes the value of ![]() is required even for a time period which extends beyond the maximum maturity, time three in our example. The common practice in the marketplace is to use the knowledge of the spot rate of interest for the discrete points (1, 2, and 3 in our examples) and generate from these an estimation of a discount factor or a spot rate for each
is required even for a time period which extends beyond the maximum maturity, time three in our example. The common practice in the marketplace is to use the knowledge of the spot rate of interest for the discrete points (1, 2, and 3 in our examples) and generate from these an estimation of a discount factor or a spot rate for each ![]() in a certain time interval. This process is referred to as smoothing.
in a certain time interval. This process is referred to as smoothing.
In the scope of this book, we will give only an overview of these techniques. The Appendix will explore these ideas further. Since spot rates are recovered from discount factors, and vice versa, the smoothing can be done in terms of either spot rates or discount factors. Our discussion of smoothing will be with respect to discount factors. Equation (3.2) showed how one determines the discount factor from the spot rate and vice versa.
The general form of smoothing techniques is based on the assumption that the discount factor for time ![]() , is a function which can be approximated by some structure. Usually, the estimation of the discount factor, denoted below by
, is a function which can be approximated by some structure. Usually, the estimation of the discount factor, denoted below by ![]() is of the form
is of the form
 = sum(`*`(alpha[i], `*`(f[i](t))), i = 0 .. K)](images/Chp3-2_8.gif) ,
,
(3.5)
where the ![]() are certain functions and the
are certain functions and the ![]() , for i=1,...,K are numerical coefficients. Hence utilizing (3.5) implicitly assumes that the discount factor function can be written in such a form. The different smoothing techniques are based on choices of the approximating functions
, for i=1,...,K are numerical coefficients. Hence utilizing (3.5) implicitly assumes that the discount factor function can be written in such a form. The different smoothing techniques are based on choices of the approximating functions ![]() .
.
The first step is to choose the set of ![]() functions
functions ![]() ,...,
,..., ![]() . Next, an optimization problem is solved in order to uncover the values of the
. Next, an optimization problem is solved in order to uncover the values of the ![]() for i=0,...,K, such that the present value of the cash flow from bond
for i=0,...,K, such that the present value of the cash flow from bond ![]() ,
, , t = 1 .. T[i]), `*`(a[it]))](images/Chp3-2_17.gif) where
where ![]() is the payment from bond i at time t, is as close as possible to
is the payment from bond i at time t, is as close as possible to ![]() , the market price of bond i.
, the market price of bond i.
To this end, one must choose how to measure the distance between the present value, calculated based on ![]() , and the market price of the bond. Here again, methods differ from one another. Some selection criteria are based on the sum of squared differences and some on the sum of the absolute value of the differences.
, and the market price of the bond. Here again, methods differ from one another. Some selection criteria are based on the sum of squared differences and some on the sum of the absolute value of the differences.
The procedure NarbitB is also capable of producing the smoothing. It uses the criteria of absolute values for measuring the distance. It is possible to think of, and display, the smoothing process as being done in two phases. In the first phase the discount factors for the discrete payment dates of the bonds are identified. In the second phase an optimization problem is solved. It uncovers the values of the ![]() for i=0,...,K, such that the value of the continuous curve
for i=0,...,K, such that the value of the continuous curve ![]() is as close as possible to the value of the discount factors at the payment dates. Whenever this is possible, NarbitB will demonstrate it with a graph. The reader will find more information about these techniques and the specification of the functions
is as close as possible to the value of the discount factors at the payment dates. Whenever this is possible, NarbitB will demonstrate it with a graph. The reader will find more information about these techniques and the specification of the functions ![]() in the Appendix.
in the Appendix.
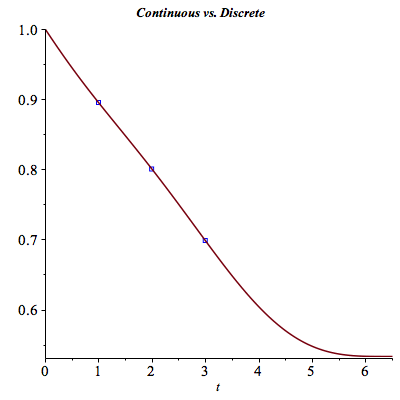
Let us now examine an example of smoothing the discount factors. For simplicity we assume a market in which coupons are paid annually. Hence in NarbitB and its output, the time unit is a year. In order to accomplish this, we need to run the procedure NarbitB as before, but with the addition of two parameters. We need to specify the number of approximating functions and the name which will be assigned to our new (smooth) discount factors function. This function is termed the continuous approximation of the discount factors.
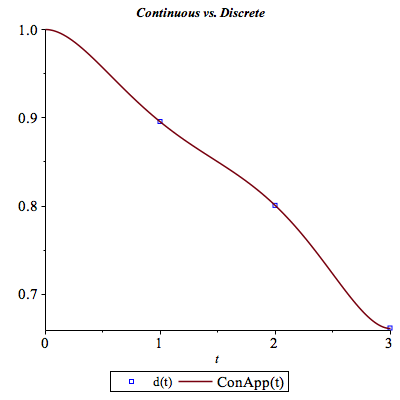
Suppose we would like to have six approximating functions (i.e., K=5), and we would like to call the continuous approximation ConApp. We thus need to run NarbitB as demonstrated below. The output of the procedure also generates a graph. This is illustrated in the Figure which appears directly following the output. (You can add a zero as a parameter at the end to suppress the graph of the discount factor, i.e., execute 'NarbitB([[105,0,0],[10,110,0],[8,8,108]],[94,97,85],6,ConApp,0);' instead of the below)
| > | NarbitB([[105,0,0],[10,110,0],[8,8,108]],[94,97,85],6,ConApp); |
 |
| > |
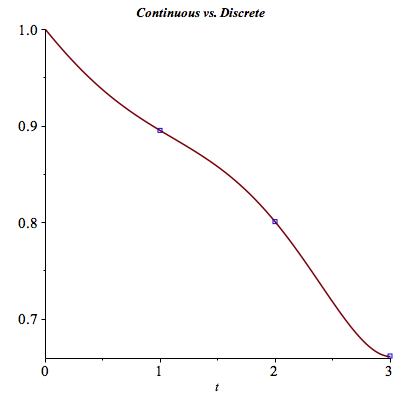
The Figure above demonstrates the smoothing process. The (blue) boxes are the values of the discrete discount factors for the times at which the bonds are making coupon payments, or are repaying the face value. The continuous graph is the result of our approximation. The function ConApp estimates the discount factor associated with every ![]() in the interval
in the interval ![]() and is being used Footnote 2 to value the cash flows payable at times other than 1, 2, or 3. Hence, to calculate the present value of $4 obtainable at time 1.75, we perform the following calculation:
and is being used Footnote 2 to value the cash flows payable at times other than 1, 2, or 3. Hence, to calculate the present value of $4 obtainable at time 1.75, we perform the following calculation:
| > | ConApp(1.75)*4; |
| > |
Similarly, to value the cash flow $4 at time 1.75, $4 at time 2.25, and $100 at time 2.75, we calculate
| > | ConApp(1.75)*4+ConApp(2.25)*4+ConApp(2.75)*100; |
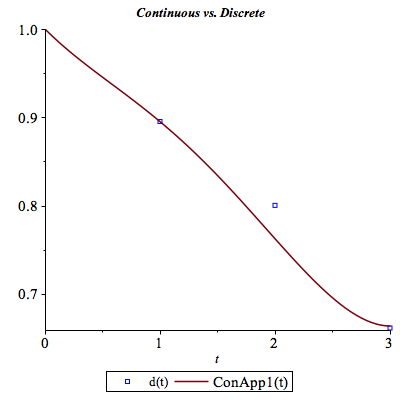
In this last example, we see that the graph passes through the value of the discrete discount factors obtained directly from the market. In this case above, we manage to fit the estimated discount factor function defined by equation (3.5) to coincide with the discrete factors obtained from the market. This, of course, is not always possible and will depend on the type and number of approximating functions chosen for the approximation. Suppose we attempt to do the same fitting with only three approximation functions. The resultant discount factor function is displayed below:
| > | NarbitB([[105,0,0],[10,110,0],[8,8,108]],[94,97,85],3,ConApp1); |
 |
| > |
It is now apparent from the Figure above that we do not have a perfect fit. The procedure NarbitB also defines a variable SumAbsDiv. It measures the "goodness-of-fit" in terms of the sum of the absolute deviations of the approximation from the actual observations. Thus, if the value of this variable is zero, the fit is perfect. The Appendix elaborates on this point. Each time NarbitB is run and a continuous approximation of the term structure is solved for, the variable SumAbsDiv is redefined. To check its value, issue the following command:
| > | SumAbsDiv; |
| > |
Sometimes a perfect fit is not possible and we have to make do with the best approximation possible. In fact, the situation in real world markets is somewhat more complicated. Realistic markets are incomplete. That is, in realistic markets the number of bonds is smaller than the dates on which there are payments from at least one outstanding bond. Therefore if the NA condition is satisfied, there will be multiple solutions for the set of discount factors. However, unlike the equity market, trading in the bond market is done via a set of dealers and not in a central market place. Consequently, the quotes of bond prices are with errors. These errors are due to the structure of the market and to non synchronization. Not all the bonds are traded at all times. Hence the observed prices of the bonds are prices of the last transactions and they may include prices of different times for different bonds. Consequently, even though theoretically there are no arbitrage opportunities, the NA is not satisfied by the observed prices. This however means that the set of equations solved in order to determine the discount factors or the term structure, is inconsistent. This is in spite of the fact that there are more equations than variables. Thus the term structure and or the discount factor function is estimated based on a second best solution concept (see the explanation in the Appendix). The NarbitB procedure is capable of handling such a situation. It will report that the NA is not satisfied and an an arbitrage portfolio. However, when graphing the discount factor, it will not show the discrete solution of the discount factor, as such do not exist. This is demonstrated in the example below.
| > | NarbitB([[105,0,0],[10,110,0],[8,8,108]],[94,10,787],5,ConNNA); |
 |
As mentioned before, once we have the continuous approximation of the discount factors, we can generate the continuous approximation of the term structure of interest rates. Let us try an example using only five approximating functions.
| > | NarbitB([[105,0,0],[10,110,0],[8,8,108]],[94,97,85],5,ConApp2); |
 |
| > |
| > | SumAbsDiv; |
| > |
As we see in this example, the value of SumAbsDiv is zero which means that a perfect fit was possible. Footnote 3. The relation between the discount factors, ![]() and the zero coupon curve,
and the zero coupon curve, ![]() , when the letters reported based on semi annual compounding is given by
, when the letters reported based on semi annual compounding is given by
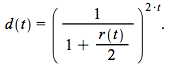
| > | solve(d(t) = (1/(1+(1/2)*r(t)))^(2*t),r(t)); |
 |
| > | subs(d(t)=ConApp2(t),%): |
| > |
| > | r:=unapply(%,t): |
| > | simplify(r(t)); |
 |
| > | r(1); |
| > | r(2): |
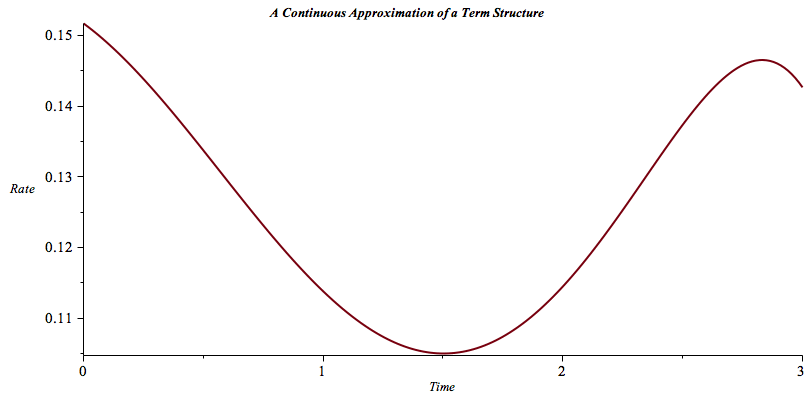
We can now plot this function and see how the spot rate in this market behaves.
| > | plot(r(t),t=0..3,labels=[Time,`Rate`],thickness=2,title=`A Continuous Approximation of a Term Structure`,titlefont=[TIMES,BOLD,10]); |
 |
| > |
The fact that the rates are reported on an annual basis allows us to compare the rates for different maturities. We see that the rates are decreasing as time increases and then, at about 1.5 years, the rates increase. Different shapes of the term structure are possible. There are a few theories which explain the shape of the term structure of interest rates. These theories are summarized in the Appendix.
3.2.1 Smoothing and Continuous Compounding
Given the discount factor for time ![]() , (we will measure time in years henceforth), the continuously compounded rate
, (we will measure time in years henceforth), the continuously compounded rate ![]() is the solution to equation (3.7),
is the solution to equation (3.7),
![]() .
.
(3.6)
Hence ![]() is given by
is given by
![]() .
.
(3.7)
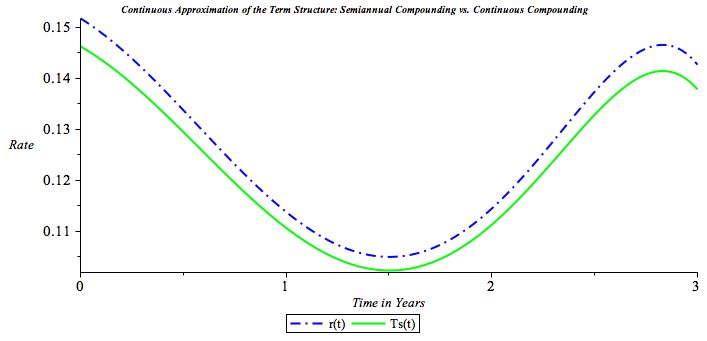
Previously we calculated the discount factor function, ConApp2, when the units of time were measured in years. Therefore, the continuous approximation of the term structure based on continuous compounding will be given by ![]() . Let us define the function Ts to be the continuously compounded term structure in our example.
. Let us define the function Ts to be the continuously compounded term structure in our example.
| > | Ts:=unapply(-ln(ConApp2(t))/t,t); |
The graphs of the continuous approximation of the term structure based on semiannual compounding (the blue upper graph) and based on continuous compounding (the green lower graph), are plotted together in the Figure below.
| > | plot([r(t),Ts(t)],t=0..3,color=[blue,green],thickness=2,labels=[ `Time in Years`,`Rate`],title=`Continuous Approximation of the Term Structure: Semiannual Compounding vs. Continuous Compounding`,titlefont=[TIMES,BOLD,8]); |
 |
| > |
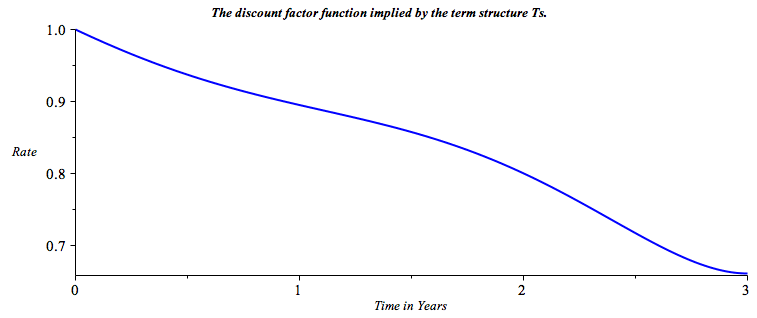
The discount for time ![]() in terms of Ts is given by the expression
in terms of Ts is given by the expression ![]() and is plotted in the Figure below. Note that indeed the discount factor is a decreasing function for which the range is between zero and one -- as it should be.
and is plotted in the Figure below. Note that indeed the discount factor is a decreasing function for which the range is between zero and one -- as it should be.
| > | plot(exp(-Ts(t)*t),t=0..3,color=[blue],thickness=2,labels=[ `Time in Years`,` Rate`],title=`The discount factor function implied by the term structure Ts.`,titlefont=[TIMES,BOLD,10]); |
 |
| > |
Note that we have not discussed or specified the evolution of the term structure across time. Rather, our discussion has been devoted to the term structure or set of discount factors that prevail in the market at a certain point. It is as if we take a "snapshot" of bond prices in the market at a certain moment, and extract the term structure prevailing in the market at that time. As time passes, the term structure may, and usually does, change. Many valuation methods, as we will see later, require some specification of a model governing the evolution of the term structure.
Yet, there are many instruments and types of cash flows that could be valued given only the current discount factor ![]() . The rest of this Chapter is devoted to two such examples. Some other instruments of these types are valued in the next Chapters. Not surprisingly, most of the cash flows we are able to value in this manner (and their replicating strategies) are static. They do not require (optimal) actions in the future and the valued cash flows are fixed and known (not stochastic) as of the the current time. These cash flows do not include any random or stochastic components that depend on a realization of some future interest rates that are not known at the present time. There is, however, an exception to this rule and this is the cash flow valued in our second example in this Chapter.
. The rest of this Chapter is devoted to two such examples. Some other instruments of these types are valued in the next Chapters. Not surprisingly, most of the cash flows we are able to value in this manner (and their replicating strategies) are static. They do not require (optimal) actions in the future and the valued cash flows are fixed and known (not stochastic) as of the the current time. These cash flows do not include any random or stochastic components that depend on a realization of some future interest rates that are not known at the present time. There is, however, an exception to this rule and this is the cash flow valued in our second example in this Chapter.